This very long and complicated essay has three main parts:
no-growth wages, inequality, and inflation.
How to read this essay: look at the graphics, skim the main ideas, and then skim again. I find it too long, and a reader will get more trying to avoid the infinite details I've provided.
Growth of weekly earnings for 80% of workers was NEGATIVE over a 57 year period: --- over a 57 year period between 1965 and 2022, states a Bureau of Labor Statistics (BLS) web page. See the first graphic below, it's from the BLS page.
Now, that was "average weekly earnings" or wages for "nonsupervisory" workers, or "employees". Looking at "median" wages, the middle level worker out of millions, we can look at the Social Security Administration reports on wage income, from 1991 to 2021 (all their reports). It shows that wages, adjusting for inflation, increased by 24.5% over 30 years; but the Real (inflation adjusted) GDP per capita increased by 59.3%, according to the Fed's FRED graph, here. The GDP/capita increased from about $37,000 per head to almost $59,000 per head. So a family of four would have, on average, an income of nearly $240,000 per year. Not likely. I find it aggravating, annoying, and irritating that so few realize that $240K is about the average income for a four person household. It is probably greater; in fact it is, using the national income found in the Fed's Flow of Funds report for 2023, March, a total national income of $22.046 trillion. The four-person family super-average income is over $236,000 --- 4 times 59,000 equals $236,000. I'm feeling poorer thinking about it. The U.S. Census reports the median household income for a family of four is $111,401 (see Hinc-01, line 65).
The same Census report, Hinc-01, shows (for 2021 admittedly) a median income for all 131 million households of $70,784 (half are earning less than $70,784). The average income for all households is $168,000 (i.e., $22 trillion divided by 131 million = $168,000). The average for the lower half is about $42,000, about a quarter of the average for all, and about a sixth of the average for the four-person household. So, I know the average reader never does 6th grade math in their heads, but take my word, it's not real complicated. So, to get to the nub of the issue, you can stop reading here and think about it. It will you save lots of confusing minutes full of endless details. Think a minute! or at least 30 seconds. Think! We need to reform income distribution, the low- to middle-earning workers need a big raise -- the logical conclusion. Now you can go about your important activities.
--- And if you are interested in what reform would look like, consider this idea for a minimum wage of $21.25 per hour. To avoid adding details in this essay, I will simply recommend 6 more additional readings about the reforms needed, see here, here, here, here, here and here --- sectoral union bargaining, worker representation on corporate boards, health care for all, public housing, a wealth tax, and anti-trust enforcement. In all seven public remedies that would go a long way. Of course there are many other remedies.
RealTime Inequality, a new web page from U.C. Berkeley economists, shows the details from 1976 to 2022. The lower 50% saw a $5,000 gain in income, from $15,000 to $20,000. The middle 40%, from the 50th to 90th percentile, saw a $39,000 gain, from $54,000 to $93,000. The top 10% saw their income grow from $154,000 to $413,000, a gain of $269,000. If the nation had the income distribution of 1976 then 90% of American households would have about $24,000 more income, and the median would be $95,000 not $71,000.
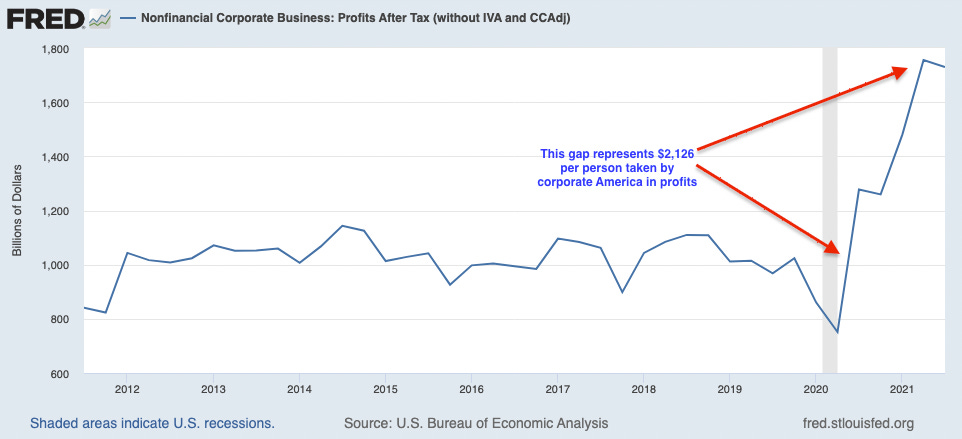
And at the bottom of the essay is "The Inflation Story". Nonfinancial corporate profits are up 69% since 2019 shows the BEA.gov; this is driving inflation several economists maintain.
____________________________________________________________________________
No-Growth Wages
The following is a guest column article I submitted to the Mariposa Gazette July 2022
I contributed a opinion piece to the Mariposa Gazette about a year ago, and I’d like to contribute another, this time about the U.S. Economy, which I study regularly. I came upon a piece of information that startled me and made me recalculate my regular one sentence summary: “Wages for workers we call employees were higher 57 years ago than today;” is the new fact that people should know. In 1965 “average weekly earnings for production and nonsupervisory workers”, 80% of all full-time workers, 105 million workers, were higher, 57 years back. It is stunning and shocking. I recall very well working in a cemetery in 1965, a summer job in Oakland mowing lawns earning $3.50 per hour; this was a great summer job. The minimum wage was about $1.50 per hour. Today, when I adjust for inflation, I see $3.50/hr. is now worth $32.82/hr., which is $1,312 per week or over $68,000 per year mowing lawns. I was 19 years old. I was in the “grounds keepers union”. (This is the web page showing the cost of labor in 1965: https://data.bls.gov/timeseries/CES0500000031)
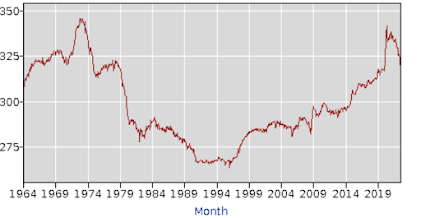
WEEKLY WAGE INCOME WAS HIGHER IN 1965 THAN IN 2022. The national per capita (per person) income has tripled, but not for 80% of the full-time workers whose weekly incomes are lower.
The average income for the lower-earning half of U.S. workers (full-time, part-time and partial year) is $14,733 in 2020, says the Social Security Administration report on wage income. There were over 167 million workers in 2020, and the lower half, 84 million workers, all earned less than $34,612.04, exactly to the penny. A full-time year-round minimum wage worker earns $15,080. The difference between $15,080 and $14,733 is $347. I just said that the mean average yearly income for half of all U.S. workers is less than a minimum wage worker. To take this a little further, half of U.S. workers earn only a small percent of the total annual national income: under 7%. (I simply added 7 numbers at the SSA table, and divided by $18.743 trillion.) I include this data just to underline how very low workers' paychecks are. Yes, 30.1% of workers are part-time or partial year workers. Almost exactly a third (33.32187%) of workers earned below $20,000 in 2020. And bear in mind that the BEA (Table 2.1) shows today that every human in the U.S. has a post-tax average income of $54,685. Three average low wage workers in the lower half do not earn the $54,685 average disposable (after-tax) income that everyone would receive it all income were evenly distributed per human -- child, adult, and elder.
Fast-food restaurant workers in California earn an average of $31,050 per year, states an article by Steven Greenhouse. This is $16.21 per hour. During the pandemic one fast-food worker reported her experience:
For Perla Hernandez, 42, working through the pandemic at a Burger King outside San Jose has been a harrowing experience.
Eight of her fellow workers came down with COVID-19 during her two years on the job. She says that included a supervisor whose positive test was kept from her until she had been working with him for hours; another supervisor pleaded with her not to go home because the restaurant was so short-staffed.
The company provided her with a mask and protective gloves early in the pandemic but didn’t arrange to replace them, even though the gloves were in shreds before her shift was over.
In the back of the restaurant, where Hernandez works as a cook, there’s no air conditioning. When she was injured on the job and had to stay home for eight days with stitches in both legs, there was no sick pay.
“We need the job, so we have to do whatever the managers ask,” she told me through an interpreter.
This is the American Dream for half of U.S. workers. There was no sick pay, as there is in other advanced countries. "All OECD countries except the United States and Korea as well as all non-OECD G20 countries have a statutory paid sick leave system in place for employees in standard dependent employment. This system generally covers full-time and part-time as well as permanent and temporary employees."
Wages or "weekly earnings" were higher in 1965 than in 2022.
As far as I can see, only Bernie Sanders and the Congressional Progressive Caucus are pushing to lift wage incomes for the vast majority of workers. Sanders published a letter in The Guardian news, September 2, 2022, laying out his case. "In the year 2022, three multibillionaires own more wealth than the bottom half of American society – 160 million Americans. Today, 45% of all new income goes to the top 1%, and CEOs of large corporations make a record-breaking 350 times what their workers earn."
If 3 own more than 160,000,000, then 1 owns more than 53,300,000 citizens, not adults. One adult owns more than 41,666,666 adults. Still disturbingly unequal. It's absurd.
The Job Quality Index, University of Buffalo, shows the average wage income for 105 million full-time nonsupervisory workers (66% of all workers, and 80% of full-time workers); their average income, June 2022, was $48,360 per year. But 45% had incomes averaging about $66,300, and 55% had incomes averaging about $33,800, which is about $16.25 per hour. A bifurcated job market we see, a little under half are earning double what the lower half earns. Two workers, husband and wife, earning $48,360, earn $96,720 -- the average income per household is over $144,000, using Joint Committee on Taxation data. Too much inequality is the obvious conclusion.
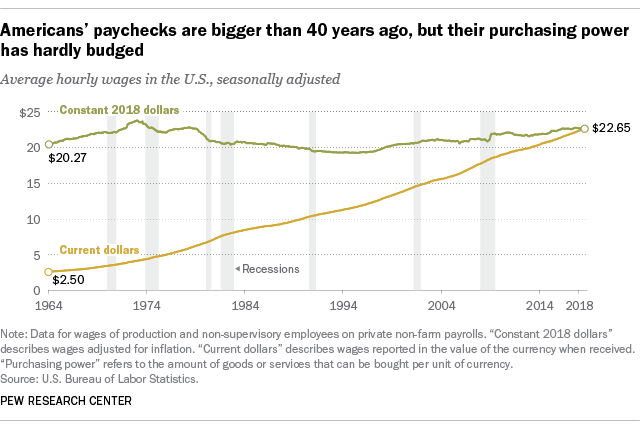
Pew Research Center produced this graph. Note that in 1973 hourly wages were higher. Pew reports on hourly wages, I referenced "weekly earnings", which is more significant than hourly:
This is a National Disaster, nothing less.
Disposable Personal Income", per capita, inflation adjusted, tripled between 1964 and 2018, that would be a 200% increase. The BEA.gov, Table 2.1, shows per capita income tripling (in chained 2012 dollars) from $14,378 in 1964 to $43,886 in 2018. According to Pew, real (inflation adjusted) wages increased by almost 12%, a far cry from the economy's average income growth of 200%. This is so stunning it should be a burning, top concern. Had the purchasing power of wages tripled they would be about $66 per hour, which is about $137,000 per year for a full-time worker. Something went wrong, dear reader, something went very wrong. Could the BEA be wrong? Or are most economists wrong? Where did all those extra dollars go to?
The Economic Policy Institute has an excellent article answering that question:
Top 0.1 percent earnings grew fifteen times faster than bottom 90 percent earningsCumulative percent change in real annual earnings, by earnings group, 1979–2017
Source: EPI analysis of Kopczuk, Saez, and Song (2010, Table A3) and Social Security Administration wage statistics
Top earners' wages grew four times faster than wages at the medianCumulative change in real hourly wages of all workers, by wage percentile, 1979–2018
Notes: Shaded areas denote recessions. The xth-percentile wage is the wage at which x% of wage earners earn less and (100−x)% earn more.
Source: EPI analysis of Current Population Survey Outgoing Rotation Group microdata
This is a well-known fact in the economic world, but seldom reported widely; I suppose Occupy Wall Street is the first place most people were exposed to the fact that average incomes have not kept up with the growth in production. The average per capita after-tax (disposable) income is now three times higher than in 1965, increasing from $15,051 to $48,219 (in chained 2012 dollars) (BEA.gov, Table 2.1). In current dollars, not Chained 2012 dollars, the per person income is $54,685, meaning an average household of 4 would earn $218,740 after paying federal taxes – that's just an average four person family. But the U.S. Census says $107,091 is the median, or middle, income for all four-person families. Not even half the average!
So
let me simplify – wages for 80% of all full-time workers -- over 105 million workers, the backbone of the U.S. economy -- have not increased since Lyndon Johnson was president, even though the economy produces three times more per person than in 1965.
You should shudder and ask what is wrong? We, or most of us, could be earning a
lot more.
_______________________________________________________________________
RealTime Inequality -- from University of California, Berkeley economists --------------
There’s a new web page available from economists at U.C. Berkeley called Realtime Inequality, and it shows income growth from 1976 to present day.
Key point: half of U.S. society sees a $5,000 increase in income over 46 years, while 10% see more than $250,000 increase in income! BEA.gov (Table 2.1) says disposable income (post-federal-tax income) per capita in chained 2012 dollars has increased in 46 years by 123%, from $20,346 to $45,444.
Income growth since 1976 is plotted in four colored lines; the top 10% (red line), the 50 to 90th percentile group (blue line), the lower 50% group (orange line), the average growth for all (the dashed white line).

You can play with this graph by choosing other variables, like "Real Income Growth", "Average Real Income", "Total Real Income", "Share of Income". And you can choose other populations like "Adults", "Working Age Adults", "Households". Note that the lower 50% has barely seen income rise in 22 years, and only by $5,000 in 46 years, from $15,000 to $20,000 per adult.
I fiddled with the choices and I find it disgusting, but it reaffirms my suspicions. I put in "Average Real Income", "Post Tax Income", "Households", and "Monthly". It shows that the average income for the 1% is 53 times greater than the average for the lower half; that is, $2.1 million for the 1%, and $39,200 for the average in the lower half, or 50% -- note that this is post-tax and post-transfer. It takes an average household, not earner, in the lower half his and her entire whole work life, 53 years, and then some to earn the average year's income of the top 1%, post-tax and post-transfer. Is that disgusting?
I discovered that the distributional share of total income for households shifted by 14.6%; the lower 90% was earning 62.4% in 1976 but in 2022 earns just 47.8%. This shift of 14.6% equals $2.736 trillion. Divide $2.736 trillion among all 117 million households in the lower 90% and each household earns an additional $23,384 each year. This would more than double the current average pre-tax and pre-transfer "factor" or market household income of $20,800 in the lower half. The post-tax and post-transfer average income is $39,200. So the lower half would increase its income by 50% to $62,584; and the median income would increase from $71,186 to $94,570 -- still much lower than the average household income, which is $144,000. This is not meaningless speculation, it imagines a world that existed in 1976. Try to imagine the quality of life under that scenario.
All of which means: pre-tax market (or factor) income distribution matters; workers are underpaid, as you can easily conclude after 55 years and no weekly wage income increase for nonsupervisory full-time workers (105 million), and also for the 17% of total workers who are part-timers (26 million workers). Eighty-three percent (83%) of workers have had no weekly pay raise in since 1965, while the GDP/capita tripled.
I know this sounds bizarro, BIZARRO !!!, it certainly sounds berserk and deranged to me. Yet it is in harmony with The RAND Corporation report in 2020, Trends in Income 1975 to 2018, showing median wage income was $50,000 in 2018, but it could have been $92,000. They concluded that yearly income of full-time workers today average to $50,000, but they could average to $92,000 had the growth rate for wages equaled the growth rate for productivity.
https://www.rand.org/blog/2020/10/a-25-trillion-question-what-if-incomes-grew-like-gdp.html
Since 1976 the lower-earning 50% of adults saw their average incomes grow from about $15,000 to about $20,000/year – up $5,000 in 46 years.
The next 40% (50th to 90th percentile) incomes grew from $55,000 to $94,000 – up $39,000.
And the top 10% saw their income grow from $154K to $413K, average –
up $269,000.
This makes
my head spin, and my stomach is feeling shaky.
Inequality is the main idea; the data for March 2022:
10% earn 46.5%, average income of $412.3K
the middle 40% earn 42.2%, average income of $93.5K
lower 50% earn 11.3%, average income of $19.9K
Simplified: 10 people earn $45,
and 45 people earn $45,
and 45 people earn $10, see the JCT below.
And we can take it further:
10 people earn $4.50, = $45
and 45 people earn $1.00, = $45
and 45 people earn $0.22. = $10 Total income = $100
Each year the 10% at the top earn 20 times the average of the bottom half.
Is that OK?
In 1976 the ratio was $1 to $3.7 to $10.3. The ratio in 2022 is $1 to $4.7 to $20.7. So the gap between the lower 50% and the 10% has doubled.
The lower half had a 33% increase, the middle 40 a 71% increase, the top 10% had a 175% increase.
But even in 1976 the distribution ratios, in my opinion, were severely unfair, and today they are far worse than bad, approaching intolerable. I criticize the Mexican economy at times; it's a state that is collapsing under the weight of severe inequality, and the U.S. is following its example.
Be sure to check the RealTime Inequality page.
See also this web page to calculate the percentile ranking of each household income level.
Two other pages have data on distribution, the Tax Policy Center, and the Visual Capitalist, which is full of fun graphics.
_________________________________________________________________
Congressional Joint Committee on Taxation, 2022

The above table, Table A-6, comes from the Congressional Joint Committee on Taxation, June 2022, page 36. It shows the distribution of income exactly. They received their data no doubt from the IRS. About 180 million tax payers report a collective income of $18.743 trillion. The average income for all tax payers is $104,709. About 70% (70.9%) make below the $100,000 average -- the average for the 70% earning under $100,000 income is $43,116. The average for those with incomes above $100,000 is $251,581. The ratio 43,116 to 252,581 is 1 to 5.83. Almost 1 to 6. One earner in the higher 30% is earning almost six times what an average worker in lower 70% is earning. Recall that above, the RealTime Inequality data, that one household at the top was earning 4.5 times more income than the 40% in the upper middle, and 20 times more than the lower 50%. So, this is in the middle, 6 times more than the lower 70% average.
The main idea is 10 earn $45 average income $500,000
45 earn $45 average income $100,000
45 earn $10 average income $25,000
It's easy to remember.
Keeping it simple: "$25,000 for 45%, and $100,000 for 45%, and $500,000 for 10%".
This is the JCT incomes and ratios. Below are the RealTime Inequality numbers, similar but slightly different.
For April, 2022, 10% earn 46.5% average income of $413,500
40% earn 42.2% average income of $93,700
50% earn 11.3% average income of $20,100
Nearly identical. It's Easy to Remember, again
10 earn $45, the next 45 earn $45, the lower-earning 45 earn $10. Another way of putting it: 10 earn $4.50, then 45 earn $1.00, and the lower 45 earn $0.22. Of course it is not exactly that ratio, but close enough. The RealTime data also supports this rounding estimate. I calculated from the JCT report that:
Above $200K group, 9.5% of tax units, earned 44.3%, and average of $486,243.
The middle group, earning between $50K and $200K, earned 45.8% of income, with an average of $100,267.
The lower 43.3%, with incomes below $50K earned 10.5% of all income, average of $25,145.
So, keep in mind the simple 10 earn $45 - 45 earn $45 - 45 earn 10 -- easiest to remember.
Society has degraded into two groups, the plushed and the crushed. ___________________________________________________________________
Hardship and Poverty
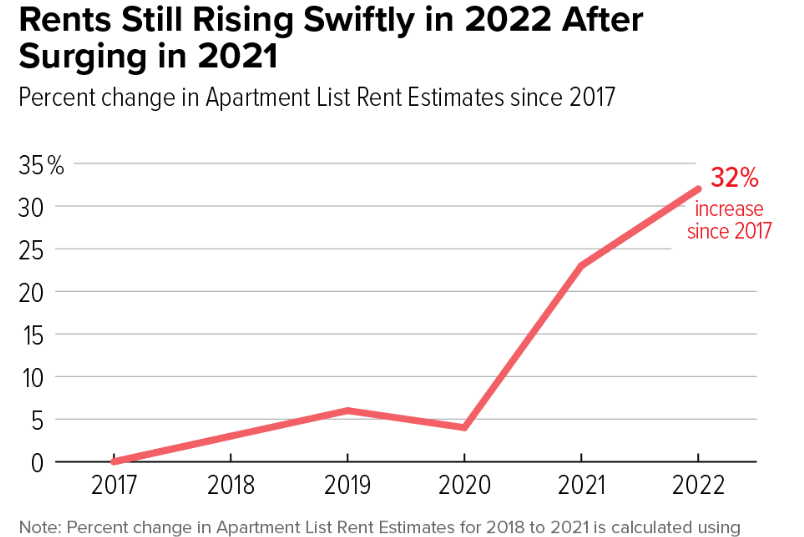
The ALICEreport from the United Way charity states that 42% of households endure hardship or poverty, finding it unaffordable to pay for seven basics: food, shelter, utilities, healthcare, transportation, phone service and childcare. A large and growing section of Americans are struggling to pay for basics such as shelter. Rental apartments have had a huge increase, shows the Center for Budget and Policy Priorities:
And here's the Federal Reserve graph showing the rise in "Median Sales Price of Houses Sold" from 2009 to Q3 2022. Since Q4 2019 to Q2 2022 prices are up 39%, from $327.1K to $454.9K, an increase of $127,800:

How did the median household income fair in "Real" income? The Fed's graph:


The Center for Budget and Policy Priorities published this graph from U.S. Census data of October 2021.
The Robert Wood Johnson Foundation, partnering with Harvard University, has issued several reports, most recently an August, 2022, poll stating that about 40% of Americans experience hardship. A key finding states: Currently, roughly half of Black (55%) and Latino (48%) households, nearly two-thirds (63%) of Native American households, and one-third (29%) of Asian households in the U.S. say they are facing serious financial problems paying off credit cards and loans, affording food, medical care or prescription drugs, and problems paying mortgage or rent, as compared with 38% of White households.
To counter this impression, the U.S. Census' report, the Supplemental Poverty Measure, issued in September, 2022, shows the poverty rate at 7.8%, a record low; on page 1 it states: "The SPM rate in 2021 was 7.8 percent, a decrease of 1.4 percentage points from 2020. This is the lowest SPM poverty rate since estimates were first published and the third consecutive decline (Figure 4 and Table B-2). • The SPM child poverty rate fell 46 percent in 2021, from 9.7 percent in 2020 to 5.2 percent in 2021, a 4.5 percentage-point decline. This is the lowest SPM child poverty rate on record." (The Brookings Institute has a comprehensive report on the temporary Child Tax Credit, it's first sentence says: "The 2021 temporary expansion of the child tax credit (CTC) was unprecedented in its reach, lifting 3.7 million children out of poverty as of December 2021."; and the U.S. Census as well.) On page 7 of the SPM, a graph shows the SPM poverty rate since 2009; it held between 14% and 16% for 9 years, until 2017, and then began to slope downwards. Two years ago, 2019, the SPM rate held at 11.8%, in 2021 it was 7.8%. (See page 58 for a table.) The most important page in the SPM is page 14 showing income ranges for all U.S. households --- 7.8% fall into poverty, 66.8% are in the middle between poverty and 4 times poverty, the last 25.9% are above the 4 times poverty level. The entire nation could be 4 times above poverty level if we tried harder.
These three reports give conflicting signals. Do we have 40% with hardship and poverty or do we have record low poverty? Or both?
When all households earn an average of $144,000 (that's $18.743 trillion divided by 130 million households), one must seriously question how hardship or poverty could exist. The only sensible answer is that ignorance, greed, and dysfunctional policy are at maximum levels.
A new podcast from the Roosevelt Institute seems determined to solve the problem of our national disaster, How to Save America. I don't know when they began the podcast, but they have the right approach. One of the co-hosts, Michael Tomasky, authored a recent book, The Middle Out: The Rise of Progressive Economics and a Return to Shared Prosperity.
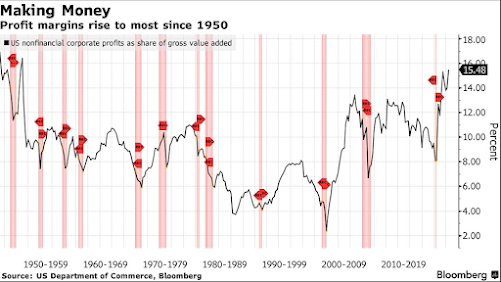
To make America better, if not great, will require many changes: we need the PRO Act (Protecting the Right to Organize) to increase labor union power, and the Reward Work Act to put workers on corporate boards. (I recommend The CenturyFoundation for background.) Our largest corporations are sending more than 90% of their profits to shareholders, and in 2022 the profit to GDP is at a 70 year high.

Economist William Lazonick has been writing for over a decade about corporations buying back their stock issues, to drive up their price. His article at the Harvard Business Review won the award of best article of the year for 2014. Here's an article at the American Prospect.
But mostly now we need public investment. Think of the Interstate Highway
System, the G.I. Bill, and Medicare and Medicaid, Social Security, not to
mention the enormous investments in the military, including the Veterans
Administration, over the years since 1950.
I think of
an eight year-old girl standing in a full body cast in a public school for
disabled children where I worked, only her eyes and nose were visible. This is
the essence of public investment. Public roads, highways, libraries, schools,
airports, the Golden Gate Bridge, massive public damns, etc., all public
investments.
Public investment also pulled the country out of the Great Depression, as the unemployment rate dropped from 25% in 1933 to 9.6% in 1937. This article, linked to in the last sentence, also states, the workfare programs of the WPA and PWA "also built or renovated 2,500 hospitals, 45,000 schools, 13,000 parks and playgrounds, 7,800 bridges, 700,000 miles of roads, and a thousand airfields. And it employed 50,000 teachers, rebuilt the country’s entire rural school system, and hired 3,000 writers, musicians, sculptors and painters, including Willem de Kooning and Jackson Pollock. So much for the notion that government jobs are not “real jobs”, as we hear persistently from critics of the New Deal!"
Without public investment we would have been unprepared for the military mobilization of the 1940s. The Build Back Better Act should still be passed, and even better would be the heftier proposal from Bernie Sanders and other progressives that would add $10 trillion over ten years of new investment, creating millions of living wage jobs, and much needed public services, and making use of $2.5 trillion would build 10 million public “permanently affordable housing units”.
We are a
very high earning society, as the average pre-tax household income is $161,000,
using the figures from the BEA.gov, Table 2.1. from the Commerce Department,
and according to the Congressional Joint Committee on Taxation (page 36) the average is
$144,000. Yet half of households have incomes below $67,521, and the average
income for the lower half is just above $40,000. This is severe inequality. The
total private savings is now about $150 trillion (with a T, trillion), and the
annual federal spending is around $6 trillion. The average savings per
household is $1,100,000, yet half own about a tenth of that or less (see here, Federal Reserve's Flow of Funds, page 2 and Table B.101 page 138, and see here, Credit Suisse, Databook, page 136). The lower-saving 40% of adults own collectively 0.2% of all wealth, about $2,000/adult. We have the
monetary resources, but we lack the vision and determination to put these
resources into productive action. In a sense we are being scalped by the ultra-high
income and wealth households in the top 1%, but we are also willingly
permitting our own scalping.
END of the newspaper column of July, 2022
_______________________________________________________________________
I have looked at these sources for reports concerning hardship, poverty, and the pandemic economy:
The Center for Budget and Policy Priorities, "Tracking the Covid-19 Economy". Feb. 2022.
The Robert Wood Johnson/Harvard University survey of August 2022.
The Consumer Financial Protection Bureau survey Dec, 2021, "Making Ends Meet".
The Brookings Institute's complex examination of the pandemic economy. "Bolstered Balance Sheets: Assessing household finances since 2019". March 2022.
They are all excellent. The CFPB is very positive, explaining that households at all income levels reported improved financial security in 2022 relative to 2019. From the Conclusion: "The pandemic reshaped many consumers’ finances. But despite high unemployment and new economic disruptions, the average consumers’ financial status improved sharply at the beginning of the pandemic and continued to improve through June 2021."
_______________________________________________________________
An NPR News article, August 8, 2022, cites a Harvard/Robert Wood Johnson Foundation study showing about half of U.S. households are having difficulties paying basic expenses; the report's lead author states: "In this period when we're all suffering from inflation, people are at high risk for either being homeless or actually not being able to feed their families." And from the report, "– Serious Financial Problems: Currently, 55% of Black, 48% of Latino, 63% of Native American, and 29% of Asian adults in the U.S. say they are facing serious financial problems (Whites: 38%). • INFLATION – 58% of Black, 56% of Latino, 69% of Native American, and 36% of Asian households say recent price increases have caused them serious financial problems (Whites: 44%).
A Primerica poll shows all-time high marks for a tightening of family budgets; some 75% report their incomes are "falling behind the cost of living". This is poll interviews families with budgets with incomes between $30,000 and $100,000, which is between the 23rd percentile and the 67th percentile, which is 44% of all households. I'll save you the math, this means 56% of households are "falling behind the cost of living."
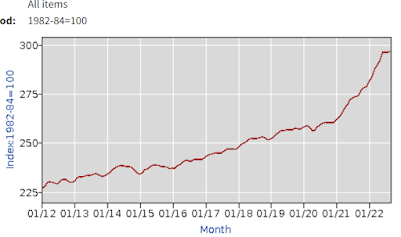
An article from the Bureau of Economic Analysis, BEA, shows they are attempting to collect and report data on this issue. The "summary file of inequality metrics 2000-2019" shows the "mean income" in 2019 was $143,422, not far from my estimate of $144,000 using CJCT figures. The BEA table shows the lower-earning 50% earned 21.0% of all income, while the RealTime Inequality shows they earned 16.2%. The inflation adjusted median household income had, in 19 years, increased by 21.0%; RealTime shows a 16.7% increase over 19 years. Yet the U.S. Census, its report on Income, reports a median household income of $69,560 in 2019, having increased by 9.9% since 2000. (page 28, Table A2 -- And by 16.0%, page 80, same report, using a different inflation index). The "average weekly earnings for production and nonsupervisory workers", the graph at the top of this blog entry, shows a growth of 11.5% between 2000 and 2019. The BEA.gov Table 2.1, shows "disposable income per capita" increasing by 32% from 2000 to 2019. As to be expected, the middle of the economy has lagged far behind the overall growth of the economy.
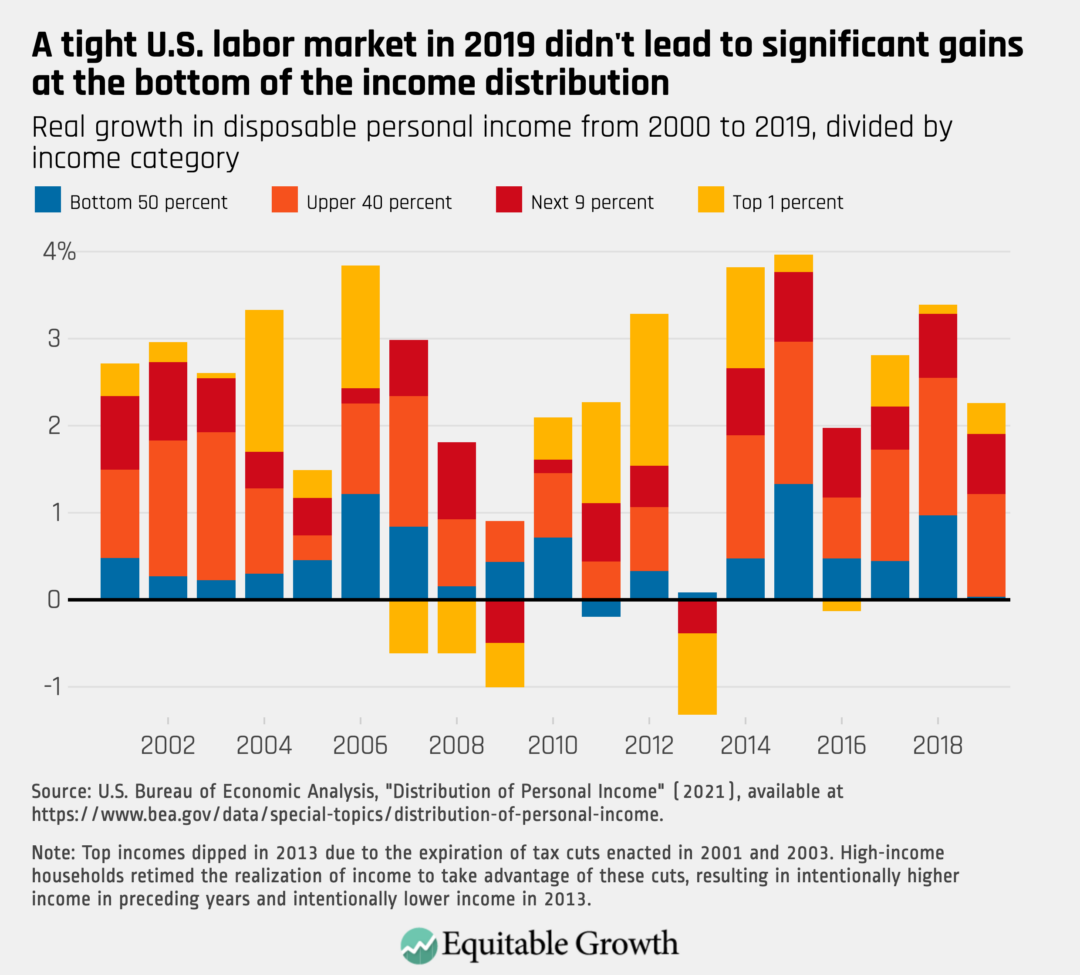
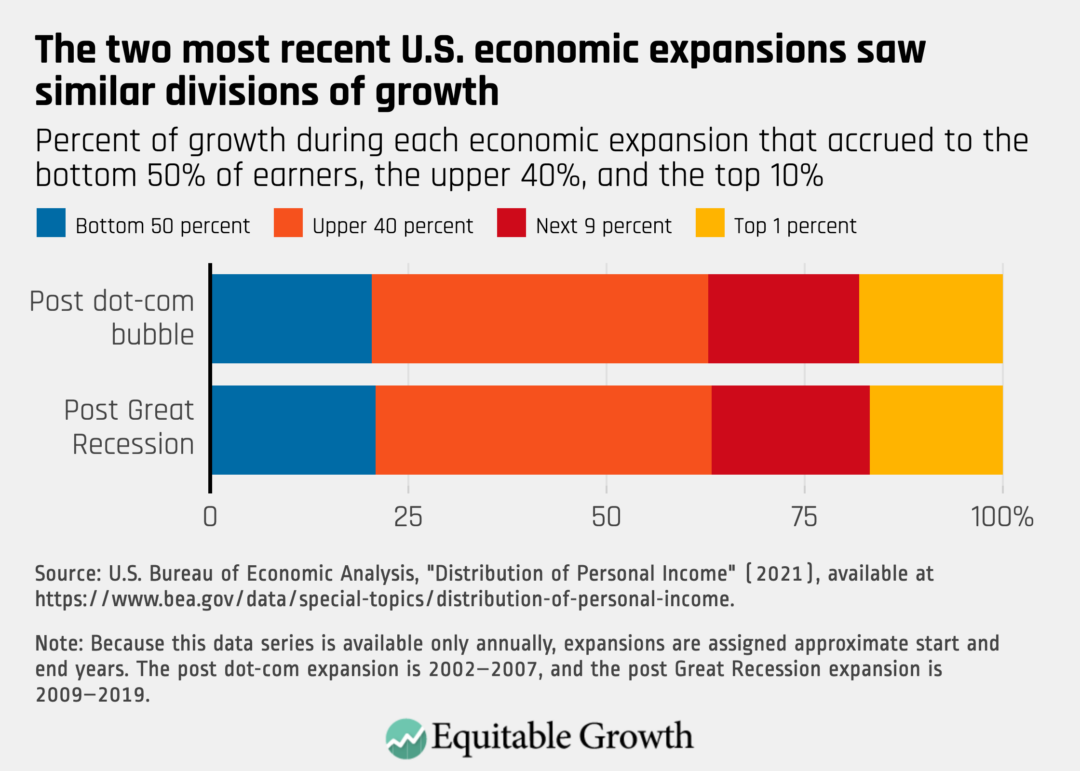
The above graph comes from an article from Equitable Growth, by Austin Clemens; a second graph from the study shows the distribution of growth during recent economic expansions, 2002-2007 and 2009-2019. The question to ask is: How did the lower 50% fare, the blue section? Their incomes hardly grew. The next graph shows the same 20 year period, but divides it in two.
________________________________________________________________
The Inflation Story --- A few graphs from the Federal Reserve
Median worker's weekly wages, for the 80% of full-time workers who are nonsupervisory workers, are back to the 2019 level:

https://fred.stlouisfed.org/series/LES1252881600Q The dubious claim that very high worker wages are driving inflation must be wrong. Further down I cite an article by Mike Konczal showing that corporate price markups above the cost of production are at a 40 year high. These are serious professional reports Konczal cites, and they refute definitely the argument that wage growth is pushing inflation.
Corporate profits per unit value of real gross value added increased by 35% since 2019 Q4, see this graph.

Here is a shocking detail of our economy, if you give it some thought --- The value of stock equities and mutual funds increased by almost $20 trillion, an 86% gain in 27 months! An 86% gain! See graph at the Fed As I've stated in my last essay, hoarding is a waste of resources.

The ratio of disposable income to wealth (household net worth) is at an all time high. See page 138 at the Fed's Flow of Funds, at the bottom. Net worth (household net worth) to DPI (disposable personal income, which is total national income less federal tax expenses)
is 818% in June 2022. It was 665% in 2018, and was 448% in 2009 Q1, and was 527% in 1996 and was 488% in 1988 (I searched Table B.101 through various years of the Flow of Funds). For 50 years, 1950 to 2000, this ratio had been close to 5 to 1, national wealth to yearly income. Now it's 8 to 1, implying excess savings, which is wasted resources. About 40% of current wealth, or about $58 TRILLION is excess (the annual federal budget is around $5.5 trillion). We could tax away $58 trillion and eliminate all other federal taxes for 10 years, and return to a normal ratio. What would be the effect? Prosperity?
The Fed has a graph with different figures, but it's illustrative of the trend:

What has caused this extraordinary surge in savings, and is it a good sign for the economy? As professor William Lazonick has shown, as I've noted, corporations are devoting over 90% of their profits to dividends and stock buybacks. This is a tidal shift in the distribution of income. Journalist Colleen Boyle has published several articles about this shift, here's one graph.

The RealTime Inequality site shows a shift, 1976 to 2022, of 14.6% of national income from the lower 90% to the top 10%; and 14.6% of $18.743 trillion, the Congressional Joint Committee on Taxation total income figure for 2022, is $2.736 trillion, which divided among 117 million households (the lower 90%) is $23,384 per household, call it $23,000. This is a national disaster. I'm repeating myself.
I made a comment on an article by economist Jack Rasmus drawing upon the DPI to Net Worth figures I've just mentioned. Rasmus made a comment on my comment,
Read chapter 12 of Keynes ‘General Theory’ and the implications for capitalism of the trend toward ‘speculative’ investment at the expense of ‘enterprise’ investing. The former creates the massive financial asset wealth you note, aided by the capitalist state, which is the basis of the accelerating inequality last 40 and especially 20 years. The figures you cite are the result, in the USA alone, of $10T in no cost money provided by the Fed to banks and investors; the $15T of fiscal tax cuts for corps and investors just since 2001; and the $13T in F500 distribution to shareholders in stock buybacks and dividends just since 2008; and so on and on. Much of this money capital gets funneled into financial markets worldwide that then multiply the fictitious value of the money capital. 21st century capitalism is a massive income and wealth distribution (and redistribution) machine for holders of capital. Fiscal and monetary policy no longer function to stabilize the economy’s business cycles but to redistribute money capital and wealth to the few.
$10 trillion originating from the Fed
$15 trillion in tax cuts since 2001, even though the Iraq war was very expensive
$13 trillion in corporate largesse to shareholders --- total $38 trillion of resources unwisely used. The total net worth increased from $48 trillion in Q1 2009 to $150 trillion in Q4 2021 (for 2021 see Fed's Flow of Funds, page 2 and for 2009 this Flow of Funds, Table B.101, page 104).
As I've noted before, in March, 2009, the Fed's Flow of Funds shows "total household net worth" of $48 trillion, after the collapse of the housing market and the financial system. In Q4 2021 the "total" was over $150 trillion. After adjusting for inflation that's a gain of 135%. The Fed's graph shows the GDP per capita grew by 19%.----- Economy grows by 19% --- Wealth grows by 135%
This is the crux of our problem.
_________________________________________________________________________

That's an added and unnecessary $961 billion paid by consumers to corporations. Instead of benefitting working Americans, $961 billion went straight into profits, then into dividends and stock buybacks, yachts, expensive vacations, etc. It's an added yearly expense of $7,392 for all U.S. households. The expenses are higher, and every dollar earned is worth 14% less.

If costs are $100 and price is $160, then the mark-up is 1.6. The report ends in 2016, and Konczal's report takes the data to 2021, and concludes "In 2021, markups suddenly increased to 1.72—that is, the average markup charged in 2021 was 72 percent above marginal cost." How clear could it be?


Median Sales Price of Houses Sold for the United States