I have not touched this blog in six months except for updates on the Covid-19 posting, and I haven't touched that one in about 2 months - today is 12.16.20.
Here's a comment that sums up my position on the economy:
The average U.S. household owns a net worth of $965,000 in September 2020. Of course "average" is not "typical" or even "normal". Total household net worth: $123.520 Trillion (Flow of Funds, Fed. Reserve, p.2), and there are a total of 128 million households. Divide 128 into 123.520 = $965,000 per household. And also $494,000 per adult. That is a wealthy nation. But -- About 40% of households own very little. The Databook for the Global Wealth report at Credit Suisse bank, page 168, shows the 40% least wealthy adults own 0.1% of all savings, and that's about $1,230 per adult. In fact 54% of adults (or 135 million adults) report owning less than $5,000 in “liquid assets” states the Consumer Financial Protection Bureau report “Financial Well-Being in America”, p.80, 2017. And about 70% or more are living paycheck to paycheck. The United Way charity says that 40% live with hardship or in poverty, unable to afford seven basics of life: food, housing, utilities, healthcare, childcare, phone, transportation. And by January 2021 that 40% may have reached 50%, their report "On Uneven Ground" states. --- The system is broken, and the U.S. economy is in a very sad state, it can’t be emphasized too much. Since January 2009 total wealth has doubled in the U.S., from $48 trillion to $123 trillion. But the GDP did not double, workers' "average weekly wage earnings were actually higher in March 1965 than in March 2020, prepandemic, see the BLS page. How could total wealth double in 11 years of anemic, slow-motion economic recovery after the Great Recession? How? -- it's a question no economist seems willing to tackle. The reforms needed are many, such as: A $15 minimum wage is just a starter. Workers have to sit on corporate boards, they need the PRO Act to increase their bargaining power. The largest 500 corporations in the last ten years have allocated over 90% of their profits to dividends or stock buybacks, about $910 billion per year, or $9.1 trillion over ten years, ignoring raising workers' wage income, a tragedy and disgrace (see this article by William Lazonick). And a report from the RAND Corporations concludes that $2.5 trillion in annual income that once went to the lower-earning 90% now goes to the upper 10% of earners; the average yearly income for a "full-time full-year prime age" worker (including supervisory workers) has risen from $42,000 in 1975 to $50,000 in 2018, but it could have risen to $92,000 had wage growth match productivity growth, as it had between 1946 and 1973. Imagine, $92,000 per year average! Check the report, page 11. Healthcare, childcare, housing and education costs must go down. Mostly we need public awareness, which will spark deep radical changes. I write a blog, Economics Without Greed, part two, but other places carry the same message, Washington Center for Equitable Growth (read "A Tale of Two Countries"), Inequality.org (see their Facts page and subscribe to the weekly newsletter), the Poor People’s Campaign. Bernie Sanders (see his Programs page, he advocates
- End the housing crisis by investing $2.5 trillion to build nearly 10 million permanently affordable housing units.
. Even Senators Gillibrand, Warren, Markley, Sherrod Brown and others endorse a tax on wealth. We have to pull the wax out of Biden’s ears and all other deniers. I was commenting on this article about a study titled "The Economic Consequences of Major Tax Cuts for the Rich".
How Covid-19 Will Magnify the Poverty Problem
American families must now brace for the steepest collapse of GDP since 1958, says Barron’s magazine of March 20, 2020, quoting Goldman Sachs and J P Morgan banks. A quarter of GDP will soon be missing, a drop from $21.4 trillion to $16 trillion is projected. Personal and household incomes will collapse also. This is will be a year to remember.
--- Update, August, 2021 -- The economy shrunk by 31.4% says the Bureau of Economic Analysis, Department of Commerce, see here. For year 2020 GDP shrunk by 3.4%, officially. In Q1 2009 it shrunk by 8.5%, in 1958 by 4.5%. As I report above, 56% of the lost jobs were among the lower-paying third of workers. The CARES Act was signed into law on March 27, 2020, providing $2.2 trillion of relief and support to the economy.
Americans are not financially prepared for this. In September 2017 the Consumer Financial Protection Bureau published a Financial Well-Being report and asked adults "How much money do you have in savings today (in cash,checking, and savings account balances)?” This is called "Liquid savings." (see page 80)
less than $250 — 24%
less than $1,000 — 35%
less than $5,000 — 54%
less than $20,000 — 74% American adults answered.
Meaning the majority are not prepared for an extended loss of income.
The Prosperity Now web page, Scorecard, found that -- Nationwide 25.4% of credit card holders have reached the 75% of credit limit on their cards;
Those who have saved for emergencies — 57.8% have saved — 42.2% have not saved
Consumers with Debt in Collections — 21.2%
Another poll asked about missing a paycheck, every two weeks, would it be a difficulty? The American Payroll Association reports 74% said yes; 40% said a major difficulty, and 34% said a slight difficulty. A Harris poll found that respondents say they always (23%) or usually (17%) or sometimes (38%) live paycheck to paycheck, for a total of 78%.
Looking at the annual wage report from the Social Security Administration, the latest year 2018, I divided workers into 4 roughly equal groups. All 167 million workers who submitted W-2 forms, so that would be about 42 million per group, or 25%, roughly.
Average Yearly Percentage Percentage
Wage Income of Workers of Nat'l Income
Group One $6,239 27.1% 1.9%
Group Two $24,819 25.5% 7.0%
Group Three $47,441 25.0% 13.5%
Group Four $133,488 22.4% 33.5%
Total --- 55.9% of National Income
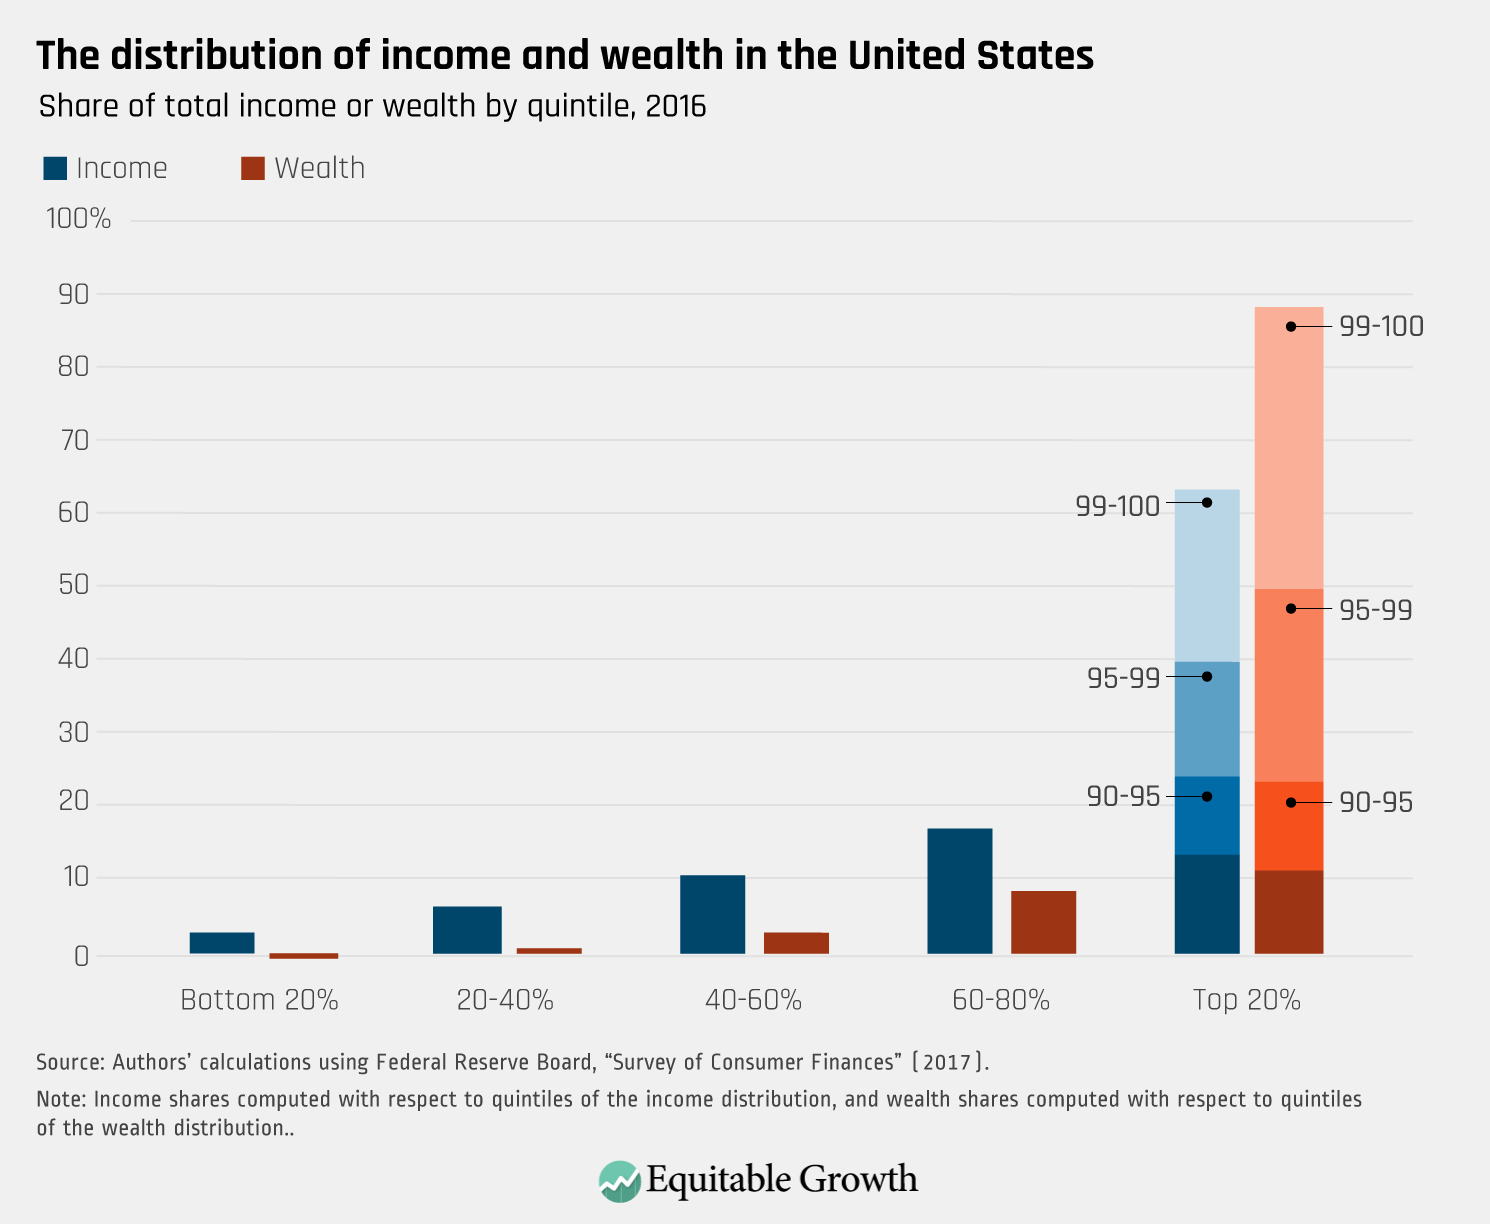
Take a look at the distribution graph from Washington Center for Equitable Growth. The income share for each quintile is and the wealth share is
1st --- 3% 1st --- 1%
2nd --- 6% 2nd --- 1%
3rd --- 10% 3rd --- 2%
4th --- 17% 4th --- 8%
5th --- 63% 5th --- 88% (top 1% --- 38%)
For a clearer view of this income distribution, see State of Working America, Income, Table 2.4. The data in the Table 2.4 is from a CBO study of 2007, and it shows that the lower earning 40% earned 13.0% of all wage income when wage income amounted to only 54.3% of all income. That equates to 5.2% of the national income -- multiply 54.3 times 13% = 5.2 -- being earned as wages by the lower-earning 40%. Yes, it looks complicated, and it is, but actually fairly simple once you grasp the complex chart.
Sources of pretax comprehensive income, by income group, 2007 (2011 dollars)
The most important fact here is that total wage income amounts to just $8.38 trillion, which in 2018 was only 47% of the total income ($17.8 trillion) reported by the BEA.gov Table 2.1, or just 56% of total income ($15.0 trillion) reported by the Congressional Joint Committee on Taxation (see page 34).
Take the total wage income for the lower-earning half -- $1.2 trillion -- and it turns out to be just 8% of all income (Joint C. T.) or just 6.7% of all income (BEA). What is total income divided by all workers? $91,000, or $106,000. But the average for the lower half is $14,300. Pitiful.
The market forces are destroying the market, you might say. A race to the bottom results in few being able to purchase necessities, a gradual enervation, debilitation, and sapping of economic vitality. !!!! The crisis that is totally ignored, one would conclude.
The Brookings Institute report “Meet the Low-Wage Workforce” examines the incomes of roughly half of U.S. workers, the low-earning half. It shows that $19,000 a year is the average income for 67% of workers who earn below the median wage income for all workers, $32,838. The other 33% are very low earning workers earning below $7,500 a year. If we take the total income in the economy, about $18.8 trillion, and divide that among the 168 million workers, we arrive at an average of $112,000 per worker.
My essays of August and of December are easy reads, and the imbalanced state of the economy is simply explained. You might wish to read those two essays.
The BLS shows that 69.5% worked full-time year-round in 2017. So around 50 million of the 165 million workers were less than f-t y-r.
Many household budgets cannot fall back on savings to get through a "shelter in place" order. Without savings and without an income, many Americans are between a rock and a stone wall. A HUD.gov site says that 9% of Americans pay more than 50% of income on housing. A Harvard University study shows that 30% of Americans pay over 30% of their income on housing. Another Harvard University study found that 1 in 4 renters pay more than 50% of their income in rent. Workers in “non-essential” jobs no longer have incomes, they are directly affected by the work stoppage, and many rent their living quarters.
__________________________________________
June 12, 2020, Insert -- A Survey from the U.S. Census, May 2020- how the nation is holding up.
The U.S. Census has conducted five flash surveys since the beginning of May, the Household Pulse Surveys. I’m looking at May 21 to 26, Food Table 2a, (and other tables) it says that 60% of all employed adults nationwide experienced a loss of “employment income”, either personally or a household member (that’s 119 million out of 198 million after subtracting 38 million “retired” and 14% in other categories). Questioned about “Reason for recent food insufficiency”, 61% reported “Couldn’t afford to buy more food”. (Food Table 4). And 49% report being “not at all confident” or “somewhat confident” when asked “Confidence in being able to afford food next four weeks.” And around 50% are “feeling nervous, anxious, on edge” and “not being able to stop or control worrying” and “feeling down, depressed or hopeless” and “having little interest or pleasure in doing things”. And another report from EPI (dot org) says 32.5 million, about a quarter of all, workers have filed for some form of Unemployment Insurance. There’s some hope that these conditions will instigate a voter rejection of normality.
__________________________________________
We have staggering inequality. The U.S. is peculiarly bi-polar in the department of income and wealth. It may surprise many to know, and it surprised this writer, that the average wealth per household is $924,000. On March 12, 2020, the Federal Reserve reported in its Flow of Funds report, page 2, that total household net worth peaked at $118.3 trillion. Divided among the nation’s 128 million households that comes to $924K per household. Unfortunately 40% of households own just 0.1% of all wealth, states the Credit Suisse report on Global Wealth. Average wealth per adult in that group is about $2,000.
The average yearly household income, not wealth, before taxes is over $140,000, states the Bureau of Economic Analysis, Table 2.1. But half of households have incomes below $64,000, and many of them much below $64,000. The per person annual “disposable personal income” after taxes is now $50,504 says the same BEA table. Does it surprise anyone to learn that $24,405 is the median income per person for all four person households? The average is $50,504, but half have less than $24,405 per person, and often much less than $24,405. Those in official poverty live with below $6,500 per person. See the U.S. Census hinc-01 table. The numbers are difficult to digest, but the incongruity is not.
It’s a sad truth, that many Americans are unaware of the great disparities among U.S. households. The household medians, for both wealth and income, are far below the averages which are raised by the very high amounts at the tippy-tippy-top, the 1 percent.
The United Way charity reports in its ALICE report that 40% of Americans live with hardship or experience poverty. In a land where $50,000 of after-tax income per person is a fact, and over $400,000 of savings per adult is a fact, we have 40% who struggle to pay for necessities. It is a strain on the imagination. An income of $61,589 for a four person household, in 2020, is the ALICE Survival Budget income. This is 2.4 times the poverty official level. Meaning that the poverty level is much lower than the stressed out level.
Will low income workers be able to pay for necessities over the next few months is an extremely critical and unanswered question. The nation is watching. We have the resources, the nation is very wealthy, but can and will we protect and support those who have no “spare tire”.
______________________________________________________
An Update on June 6, 2020
That was the end of the essay. On June 6, 2020, I'm adding a bit more. A 2016 article at The Atlantic magazine, “The Secret Shame of Middle-Class Americans — Nearly half of Americans would have trouble finding $400 to pay for an emergency. I’m one of them” contains this revelation of the fragility of about 60% of U.S. household:
“He [professor Edward N. Wolff] found that in 2013, prime-working-age families in the bottom two income quintiles [from the first to the 40th percentile] had no net worth at all and thus nothing to spend. A family in the middle quintile, with an average income of roughly $50,000, could continue its spending for … six days. Even in the second-highest quintile [60 to 80], a family could maintain its normal consumption for only 5.3 months. Granted, those numbers do not include home equity. But, as Wolff says, “it’s much harder now to get a second mortgage or a home-equity loan or to refinance.” So remove that home equity, which in any case plummeted during the Great Recession, and a lot of people are basically wiped out. “Families have been using their savings to finance their consumption,” Wolff notes. In his assessment, the typical American family is in ‘desperate straits.’”
This article is rich with insights about financial insecurity, such as this finding:
“. . . and the study by Lusardi, Tufano, and Schneider found that nearly one-quarter of households making $100,000 to $150,000 a year claim not to be able to raise $2,000 in a month.” And, “About 38 percent of households carried some debt, according to the analysis, and among those, the average was more than $15,000.” And, “The American Psychological Association conducts a yearly survey on stress in the United States. The 2014 survey—in which 54 percent of Americans said they had just enough or not enough money each month to meet their expenses—found money to be the country’s No. 1 stressor.” The author, Neal Gabler, finishes with, “What so many of us have been suffering for so many years may just seem like a rough patch. But it is far more likely to be our lives.”
And the Federal Reserve sponsors many reports on financial status of Americans, one being this short one,
"Money in the Bank? Assessing Families' Liquid Savings using the Survey of Consumer Finances"
It found that only 40% of households have accumulated a 'rainy day' account large enough to weather a 3 month income hiatus, and the three month expenditure amount sums to $9,315. That leaves 60% with insufficient funds in their savings safety net. Only 28% have savings capable of surviving a 6 month income drought. But, a positive sign, many households have access to "quasi-liquid assets". In addition to liquid savings, some families have savings in "quasi-liquid" accounts, like account-type retirement plans (401k or IRA), certificates of deposit or savings bonds, or cash-value life insurance accounts. This type of savings can be accessed if needed, but there may be limitations, penalties, or taxes that have to be paid.
These accounts double the number of households able to sustain a long-term collapse of income. See graph number three. If only 40% have enough for 3 months, another 30% have enough "quasi-liquid" savings to cover the 3 month shortfall. But the simple fact remains, after three months of no income, about 70% of Americans will be up the creek without a paddle, and their retirement or insurance savings will be gone.
___________________________________________________
About Recovery Proposals
There are appearing many plans, and I'll comment on them as I get a chance. Today is June 6, 2020. The first I am interested in is by professor Pavlina Tcherneva who advocates for public direct job creation at the Levy Economics Institute.
"Guaranteeing Employment During the Pandemic and Beyond", May 2020,
"When
the CARES Act loan guarantees (with already extremely weak job protections) expire and firms
face continued reduction in demand, the layoffs that did not take place during the pandemic will
happen when the economy “reopens.” Whatever cash assistance we provide to families to keep
them afloat now, millions of them will be scrambling for the pitifully scarce jobs of the postpandemic world. And we know what many of those jobs will be: poorly paid, with no benefits
or basic employment protections, much like the ones “essential” workers currently have (the
delivery drivers, grocery store clerks, and sanitation staff). While lending and cash assistance
help firms and families pay the bills, they are not job creation policies. They are not even reliable
job protection policies."