The Never-Ending Article on the Pandemic
Update, February 25, 2022
Re: the Covid vaccines are working by preventing deaths, and Ivermectin is not working.
Today, after months of ignoring data, I looked up recent data about Covid deaths in India. I was curious about deaths in India because the death count was very low, and some people were claiming that Ivermectin, a miracle medication, was the reason; but this assertion was based on very flimsy data. Such a conclusion is -- most probably -- not true, not real, simply a fantasy of unscientific thinking. Ivermectin doesn't work, not in India, not anywhere.
Science magazine reported in January, 2022, that deaths in India from Covid were six times higher than officially reported, deaths were wildly under-reported. Previously deaths from Covid were below 500,000 in India, but epidemiologists suspect it's more like 3 million. A quote:
"India, from the earliest days of the pandemic, has reported far fewer COVID-19 deaths than expected given the toll elsewhere—an apparent death “paradox” that some believed was real and others thought would prove illusory."
" . . . current worldwide pandemic total, estimated by the World Health Organization (WHO) at some 5.45 million people." New estimates of the world's death toll will rise because of this new count. India's Covid death toll pushes up world count from 5.45 million to 8.15 million.
https://www.science.org/content/article/covid-19-may-have-killed-nearly-3-million-india-far-more-official-counts-show
Science magazine had another article that said,
"If passionate conviction could cure people of viral infection, ivermectin would work. But there's no evidence that it does."
https://www.science.org/content/blog-post/awful-trials
It continues:
"The Argentine ivermectin investigator is quoted in that link above as saying "We are not statistical people", and if that doesn't make you want to run out of the door waving your arms, I don't know what does. Because you have to be statistical people in order to investigate these issues in any meaningful way. You have to be a real pain in the ass about controls, about randomization, about sample size, about endpoints, and all the rest of the many, many, annoying persnickity details that go into running a decent trial. Slapping something together doesn't cut it. Even if it's a pandemic. Especially because it's a pandemic, because these worthless trials have led to worthless recommendations and to people dying because they believed numbers that were, in the end, crap. It's a shame, and more than a shame: it's a crime."
But it is not a crime. It's a series of meaningless studies masquerading as true.
There are many studies that "are not even wrong", the article concludes, they are simply worthless.
Ivermectin is at the top of the list.
The vaccine seems to be working, i.e., preventing deaths.
The simplest is to look at the New York Times Corona Virus Map of the U.S., see the section "Rates for Vaccinated and Unvaccinated", it shows that between 90% and 95% of post-vaccine deaths occur to unvaccinated people.
https://www.nytimes.com/interactive/2021/us/covid-cases.html
From the CDC tables and graphs on excess deaths:
Some 74% of all covid deaths happened to people age 65 and older.
Among all citizens in the U.S., of those who are 65 and above (16.5% of all U.S. citizens), some 88% have been fully vaccinated. That leaves 12%, unvaccinated among 16.5%. Therefore, 12% of 16.5% equals 2%.
That means 2% of Americans cause 74% of all recent Covid deaths.
-- see the CDC web page -- https://data.cdc.gov/widgets/9bhg-hcku?mobile_redirect=true
And that is difficult, you will need a calculator. Look instead at a simple graph:
https://www.cdc.gov/nchs/nvss/vsrr/covid19/excess_deaths.htm
This page has a "dashboard" and one can choose among graphs by "updating dashboard". You can break-it-down by state and city by choosing other "excess deaths" selections. You'll find that New York City had more than 7 times the expected deaths in the week ending April 11, 2020 -- 628.3% more than expected.
https://www.cdc.gov/nchs/nvss/vsrr/covid19/excess_deaths.htm -- (go to "Percent excess deaths" and then update the dashboard)
This brought the attention of all the U.S. upon New York City, early in the pandemic. The historic norm was predicting 2.9 million deaths in the U.S. for all of 2020, instead we got 3.4 million deaths in 2020, about 500,000 higher than expected. Over two years now we have had over 934,000 Covid deaths. The NYTimes shows 943,000 deaths as of February 25, 2022. If the U.S. had followed NYCity on April 11, 2020, we would have had perhaps 7 times the expected deaths, as New York City was trending. That would be a total of 21 million Covid deaths in one year, not 450,000. This would result in 1 in every 16 Americans dying in a year, and 1 of every 8 in two years. No one knew in April, 2020, what Covid was capable of doing, and New York was a big warning. According to the CDC file we've had just under 13% "excess deaths" than expected in the past 2 years. Other studies show in the range of 15% to 20%.
Currently ome 2% of Americans account for 75% of all recent Covid deaths. --------
These unvaccinated who are 65-years-and-over total 6.6 million humans, and they have created 75% of all Covid deaths. 6.6 million is 2% of 330 million. They are dying before they normally would, and that means their life span is ending about 10 years before it would have without Covid.
If you are in the 2% (unvaccinated and over 64), try not to join the 75%. I will miss you, we will miss you.
_____________________________________
__________________________________________________
Written in April 2020
Most important idea: It would have been far worse without social distancing policies.
Just how bad might it have been? As I have quoted from two Nature magazine articles, here and here, disaster was averted. Instead of 300,000 cases in the U.S. by April 6 there might have been 5 million -- 16 times more cases;
and instead 130,000 deaths in Europe by May 4, there might have been 3.2 million deaths -- there could have been 25 times more deaths.
The U.S. has had a second wave because it reopened too soon. (see NYTimes graph)
Social distancing and mask wearing seems to be the answer.
Both the European Union, with 444 million population, and the U.S., with 330 million, on April 25 had the same number of cases, 890,000. Now, August 29, EU has 1.85 million cases, U.S. has 6 million. The E.U added 894,000 and the U.S. added 5,110,000 -- for every ONE in EU the U.S. added 5.7 new cases. 1 to 5.7 -- ONE to 5.7. What did they do that worked? -- Serious social distancing.
See the graph at Our World in Data.
On August 31 an article appeared, at Common Dreams news site, saying
"Jonathan Reiner, a cardiologist and professor at George Washington University School of Medicine and Health Sciences, tweeted Monday that to achieve "herd immunity" without a vaccine, "about 250 million Americans would contract the virus and 1.5-2 million would die."
A Washington Post analysis found that 2.13 million deaths may be required to "reach a 65 percent threshold of herd immunity, assuming the virus has a one percent fatality rate."
The Annual Death Count in 2018 = 2,839,000
170,000 Covid-19 deaths by August 19, 2020.
Approximately 10% of all deaths by end of week 31 of 2020
Approximately 10% of all deaths by end of week 31 of 2020
This article is almost unreadable now. I've added to it since my original post, as I stretch it out. The long list towards the bottom shows the weekly changes in total infections, my weekly update. The CDC page, the New York Times page, Worldometer, Index Mundi, and Our World in Data and the John Hopkins Daily Situation report are my key sources.
Added content for September 27
The CDC has a page on "Excess Deaths Associated with Covid-19". Find it, go down to "OPTIONS, Select a Dashboard" and select "percent excess deaths". Scroll down to find New York City -- the place on the planet most deadly hit by the Covid-19. For six weeks the excess averaged at 380% or a multiple of 3.8, and on week ending April 11 the rate was 660% or 6.6 times higher the expected number of deaths. The same week in April the entire U.S. had 41% above normal or a multiple of 1.41 times normal. ----- What does that mean? There were 56,000 expected, but the actual number was almost 79,000. If that had continued all over the U.S.for a year? The normal expected 3,000,000 would jup to 4,200,00. Then 1,200,000 deaths from Covid-19. If the entire U.S. had maintained 6.6 times more deaths for a year, then about 20 million excess deaths. Very unlikely, but it shows the deadly nature of Covid-19.
Added content for September 20
Death Rates from Covid-19 -- from an article in Nature magazine, August 2020
For both men and women over 75, 1 out of 9 is the death rate. For age 65 to 75, 1 out 30 is the incidence. For ages 34 to 65 it is 1 in 200, and for those under 34 it is almost zero. Age and sex are the dominant factors in death rates — men over 75 have highest incidence of death.
Quotes from the article:
"For every 1,000 people infected with the coronavirus who are under the age of 50, almost none will die. For people in their fifties and early sixties, about five will die — more men than women. The risk then climbs steeply as the years accrue. For every 1,000 people in their mid-seventies or older who are infected, around 116 will die. These are the stark statistics obtained by some of the first detailed studies into the mortality risk for COVID-19.
Although fatality estimates are important for understanding the risk of viral spread to people in different age groups, they don’t tell the full story of the toll COVID-19 takes, says Kilpatrick. “There is a fascination with death, but COVID-19 appears to cause a substantial amount of long-term illness,” he adds."
Added content for September 6
Better than a vaccine?
A novel test solution -- a daily home test available to millions is being developed by a doctor at Harvard. "Michael Mina is an epidemiologist, immunologist and physician. He is an Assistant Professor of Epidemiology at Harvard T. H. Chan School of Public Health. . . . Dr. Mina is currently advocating for a shift towards cheap daily coronavirus tests for everyone." states The Ralph Nader Radio Hour.
You should listen, it is a big break-through.
Also the John Hopkins report from September 4 notes that the Case Fatality Rate, CFR, globally has dropped from 7.3% to around 3%. Better treatment is the cause.
Also Yemen is suffering more than any nation from Covid-19 deaths, 29% CFR. The people of Yemen also suffer now from the largest outbreak of cholera in world history. About 57% of the population lack access to safe water, sanitation and adequate health care.
Added content for August 30
About Excess Deaths —
“Not all deaths have been reported,” says the New York Times.
Through Aug. 8, estimated excess deaths were about 38 percent higher than the official coronavirus fatality count. On August 29, 2020, the NYTimes reports 182,735 deaths in the U.S., but the actual toll is closer to 252,174, if the 38% higher report is accurate. In 2018 there were 2.839 million U.S. deaths, so the actual Covid-19 deaths is going to be over 9% of total U.S. deaths in 2020, and we are still in August.
From the article:
"Through Aug. 8, estimated excess deaths were about 38 percent higher than the official coronavirus fatality count. If this pattern holds, it would put the current death toll at more than 238,000 people."
“Many epidemiologists believe measuring excess deaths is the best way to assess the impact of the virus in real time. It shows how the virus is altering normal patterns of mortality. The high numbers from the coronavirus pandemic period undermine arguments that the virus is merely killing vulnerable people who would have died anyway.”
article on worldide excess deaths: New York Times
“207,000 missing Deaths: Tracking the True Toll of the Coronavirus Outbreak”
The NYTimes reports around 800,000 world deaths from Covid-19. Apparently 20% of deaths are not reported as caused by Covid=19.
“The data is limited and, if anything, excess deaths are underestimated because not all deaths have been reported.”
“Even taking into account differences in mortality by age, experts say the death toll to date could have been much worse.” “Today’s rise in all-cause mortality takes place under conditions of extraordinary measures, such as social distancing, lockdowns, closed borders and increased medical care, at least some which have positive impacts,” said Vladimir Shkolnikov, a demographer at the Max Planck Institute for Demographic Research. “It is likely that without these measures, the current death toll would be even higher.”
15% of cases and 17% of deaths — the U.S. still far ahead of other nations.
In the last week of August, with 4% of the world’s population, the U.S still produces 15% of world’s new cases — 41,000 out of 272,000, reports the New York Times on August 28, 2020. And the U.S. produces 17% of world’s Covid-19 deaths on August 28 — 920 out of 5,426 worldwide deaths, rolling 7 day average.
Skepticism is well advised with these figures, as other nations may not report accurately. Probably the excess death figures that will be revealed in 12 months will show more accurately. Why would the U.S. have such a disproportionate case and death count? Is it just better reporting?
The NYTimes also shows the international situation is fluid, new cases in some countries are rising in a second wave. Spain, France and Japan are such examples.
__________________________________________________
“How the Pandemic Might Play out in 2021 and Beyond”,
Nature magazine article, August 5, 2020
This well-researched article gathers speculation from many career epidemiologists.
It’s not good to focus on a prediction, but one prediction they publish estimates deaths for July 2020, and July 2021: 700,000 for the first year on July 2020, 2,000,000 for the next July, 2021.
After reading it just once, the article leaves me with that too complex to understand feeling. “There is so much we still don’t know about this virus,” says Pulliam. “Until we have better data, we’re just going to have a lot of uncertainty.” --- the last sentence.
But Covid-19 is not going away, poof! It will change behavior dramatically in terms of restaurants, visits to friends, social mixing at mass events, even casual mixing at churches or shops or gyms. But the vaccine is progressing, and testing is becoming easier and quicker (see the Ralph Nader Radio Hour for an interview with Michael Mina , an epidemiologist, immunologist and physician. He is “an Assistant Professor of Epidemiology at Harvard T. H. Chan School of Public Health. . . . Dr. Mina is currently advocating for a shift towards cheap daily coronavirus tests for everyone.”)
Added content for August 23
This week new cases and new deaths, the 7-day rolling average, is down -- 42,909 per day for cases, down from 51,210 last week, and deaths 981 per day, down from 1,072 last week.
I wrote a snippet about Vietnam, and I'll share it here:
I’ve been fascinated while reading about the success of Vietnam in controlling Covid-19. If the U.S. had the same death per million ratio as Vietnam there would have been 96 deaths, not 176,000 on August 23, 2020. Vietnam has a population of 95 million, about a third the population of the U.S. Makes me wonder, how did they do it. One sentence in the report from “Our World in Data” leads me to wonder:
“ . . . hundreds of thousands of people, including international travelers and those who had close contact with people who tested positive, were placed in quarantine centers run by the government, . . .”
Even with this treatment “a survey conducted in late March by a public opinion research firm found that 62 percent of people in Vietnam believed the level of government response was the “right amount,” ranking higher than any of the other 45 countries surveyed.8” Locking up citizens who test positive! That’s a strong incentive to take caution.
The following are a few short quotes from article at Our World in Data and from the some articles from the Center for Disease Control (CDC):
Although Vietnam reported its first case of COVID-19 on January 23, 2020, it reported only a little more than 300 cases and zero deaths over the following four months.1,2 This early success has been attributed to several key factors, including a well-developed public health system, a strong central government, and a proactive containment strategy based on comprehensive testing, tracing, and quarantining. Lessons from Vietnam’s successful early detection and containment strategy are worth examining in detail so other countries may apply them to their own responses.
Vietnam established its national emergency operations center in 2013 and four regional centers in 2016.9 The centers are staffed by skilled personnel, including alumni of the Field Epidemiology Training Program, a program run by MOH’s [Ministry of Health] Department of Preventive Medicine and supported by US CDC and WHO. The program comprises of three curricula that “trains disease detectives in the field.”10 In May 2019, there are 23 alumni in Vietnam.11 This network of emergency operations centers runs exercises and trainings to prepare key stakeholders in government for outbreaks, and it has managed preparedness and response efforts related to measles, Ebola, MERS, and Zika.
from the CDC:
The Centers for Disease Control and Prevention (CDC) began working with the government of Vietnam and local organizations in 1998 to build effective and sustainable public health systems.
As CDC Vietnam moves forward into the next 100 days, collaborative and transparent working relationships with GVN and the U.S. government will remain essential.
You can look at “Worldometer Corona Virus” to compare nations’ deaths to 1 million population ratios. The U.S. ratio is today 546. Only 7 other nations rank higher. New Zealand has 4, Australia 20, Japan 9, Indonesia 25, Germany 111, Norway 49, and so on.
Added content for August 16
"Our World in Data" web pages shows, total cases, and confirmed deaths. I wanted to compare the growth between the U.S. and the European Union. Mr. Trump says "They don't test." And the EU results would be much worse if they tested. Let's forget about tests. On April 25 both had nearly the same number of cases, 890 K (US) and 895 K (EU). Since April 25
EU total cases have increased by 81%, deaths have increased by 42%
US total cases have increased by 500%, deaths have increased by 220%
Is Mr. Trump ignorant, or is he mendacious? lying outright?
He is wildly wrong, and that is sufficient for replacing him.
He should be asking "How do they do it?" But no, he snaps a blame deflecting answer.
There are lots of reasons to be fed up with him.
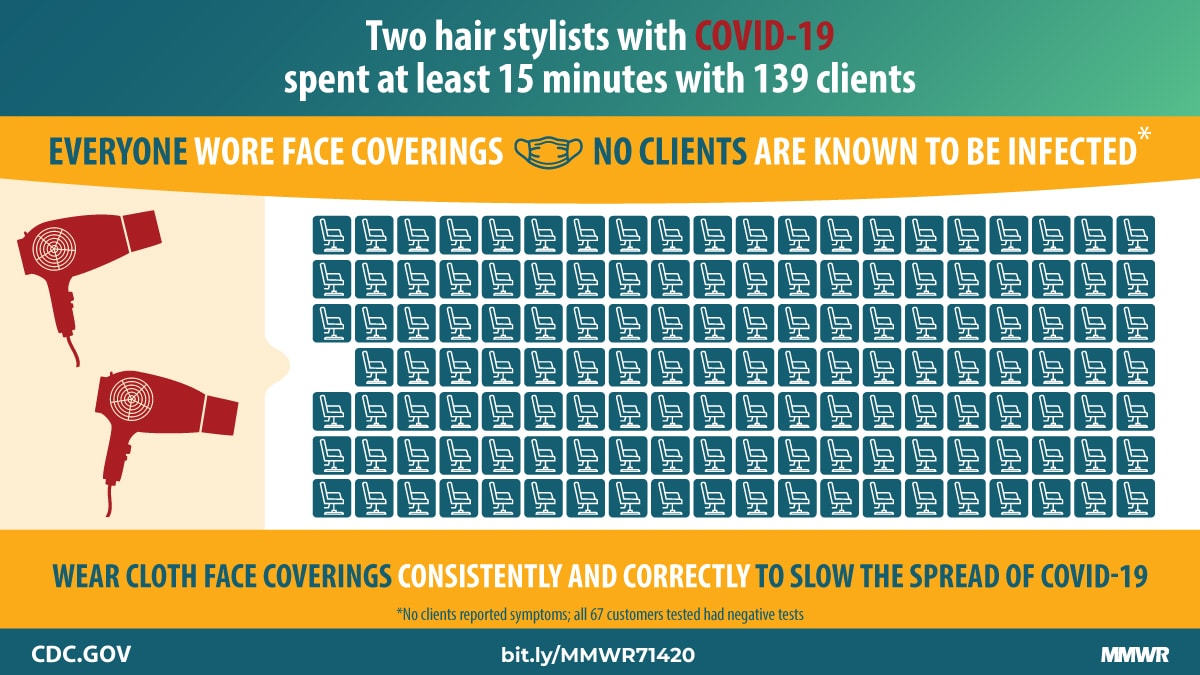
See a video presented by the AMA showing 3 women doctors advising on the importance of wearing a mask.
A poster from the CDC.
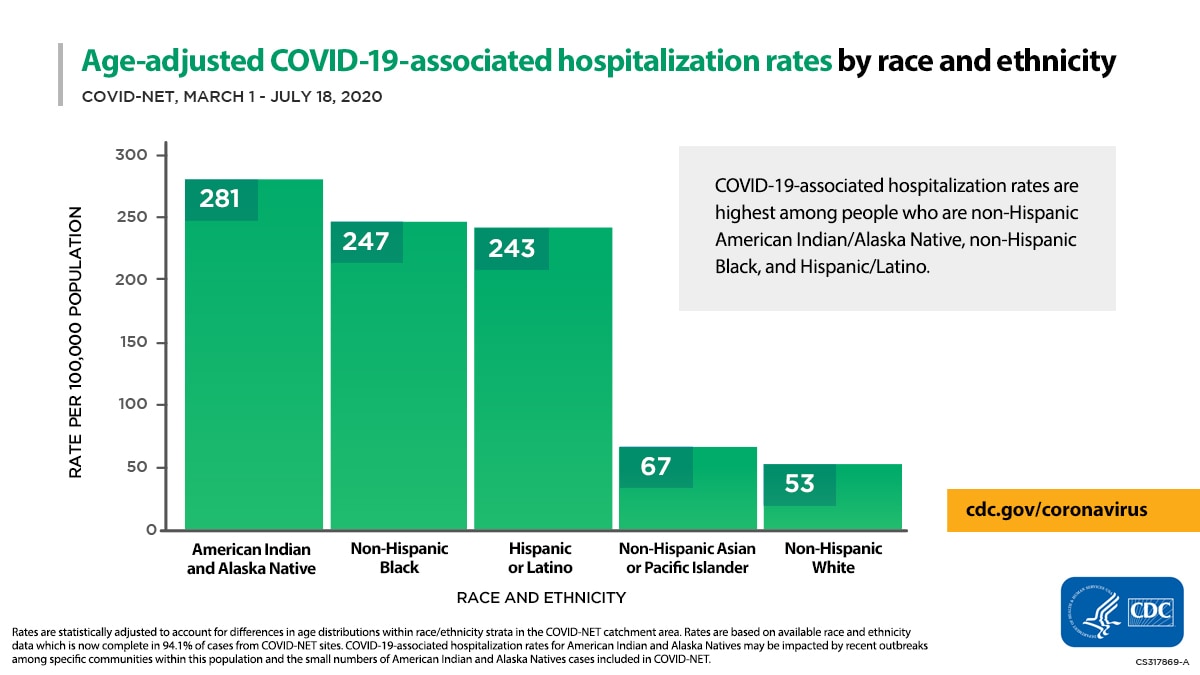
Another CDC graph showing how race and ethnicity play out:
Added content for August 8
A moderate slow-down in U.S. numbers: 1,053 deaths per day during the past week is high, and 53,507 new cases per day is double from 5 weeks ago. The U.S. produces 163 new cases per 1,000,000 each day, while the European Union produces 22. And the U.S. is still #7 in per capita daily incidence. Trump is wrong when he says that "They don't test." Reality is "They don't get sick."
Trump signs an executive order reinstating federal UI weekly relief at $300 per week.
And a Republican senator says of Trump's executive order: “No president — whether named Obama or Trump or Biden or AOC — has unilateral power to rewrite immigration law or to cut taxes or to raise taxes. This is because America doesn’t have kings,” Sasse wrote, adding a brief explanation of the Constitution. He called Trumps actions "unconstitutional slop."
The John Hopkins Daily Situation Report, 8/10 reports that
Bill Gates and Anthony Fauci have separate interviews at Wired Magazine.
"On Sunday, New Zealand marked 100 days since its last domestic SARS-CoV-2 transmission. New Zealand implemented a robust screening, testing, and contact tracing response, complemented by national social distancing policies, that ultimately led to eliminating the virus in early June. "
Added content for August 2
If total cases on July 1 had been 100, then on August 1 it would be 174. The U.S. increased total case count by 74% in 31 days. See the long long list below, far below.
The CDC reports that less than 1% of deaths have occurred to people younger than 35, and 80% of deaths have occurred to those age 65 and older.
The percentage is 40% who are asymptomatic and test positive, says the CDC. Read the footnotes for a view of the complexity of the scientific studies. The "current best estimate" also states the R transmissibility is 2.5 ("The average number of people that one person with COVID-19 is likely to infect in a population without any immunity (from previous infection) or any interventions."). An R0 of 2.5 seems medium high. “Measles and pertussis (whooping cough) have an R0 of around 15 meaning one person can transmit the disease to an average of 15 other persons in a population that has not developed any immunity or has not been vaccinated. It is worth noting that both diseases are spread via airborne transmission. R0 is also a useful measure for explaining how a new, emerging disease spreads in a vulnerable population. If R0 is less than 1 the disease will die out, if it is equal to one the disease will remain stable in a population, and if it is greater than 1 it can cause an outbreak or epidemic.” This from a report at a NIH site, paragraph on "Communicability". And the IFR or Infection Fatality Ratio is 0.0065, or 0.65%, which would create 2,145,000 deaths in the U.S. if all were infected (and 49 million worldwide). The U.S. death count for 2018, above, was 2,839,000.
The John Hopkins' Daily Situation Report adds perspective. "The US represents 22.5% of the global COVID-19 deaths —and 26% of the global cases —despite accounting for only 4.3% of the globalpopulat ion . The US is #9 globally in terms of per capita cumulative deaths —but will likely surpass France as #8 in the coming days.
Some countries have flattened or leveled the curve of deaths, France, Spain, Belgium and Italy. While Chile, Brazil and Peru are doing the worst. (use this hyperlink from the above quote)
The WHO reported that 80% of cases are mild or asymptomatic. If that is true for the U.S. then almost
20,000,000, or 6% of the U.S. have been infected.
Clicking the hyperlinks in the Hopkins' report, July 31, reveals interesting highlights. About closing schools in March, "They estimate that school closures could have prevented 1.37 million cases over a period of 26 days and 40,600 deaths over a period of 16 days. --
This report found that by closing schools 40,600 deaths were avoided (in 16 days) by May 7, when total deaths had reached 73,430 (says the chart at Index Mundi). Other news about Brazil, vaccines and sports are found in the report.
Probably the biggest news coming will deal with apartment evictions in the U.S.
Added content for July 26
A bad week again, average weekly deaths rising and cases too.
Added cases -- March 213,114
-- April 849,006
-- May 725,234
-- June 850,160
-- July 2,000,000 -- looking for a downtrend, but making an uptrend
-- July 1,963,686 new cases added in July
To see the track of the death count visit the New York Times Corona Virus page.
From the John Hopkins Daily Situation Report, July 24:
From the first case reported in the US on January 22, it took 81 days to reach 500,000 cases and 98 total days to reach 1 million cases. (from 500,000 to 1 million took just 17 days, April 12 to 29) From there:
1 million to 2 million cases: 44 days
2 million to 3 million cases: 27 days
3 million to 4 million cases: 14 days
How fast can it accelerate?
There is a pattern: about half as many days to reach the next million. During the month of March cases doubled every 2.3 days, about 40% more every day, extremely rapid. It took 41 days (27 plus 14) to double from 2 million to 4 million, maybe increasing by 2% a day. See list below: on June 14 there were 2,063,812 cases, and now more than 4,000,000.
". . . national COVID-19 hospitalizations are now equal to the country’s first peak in mid-April."
Southern states are doing much worse than all others. Florida is currently reporting more than 11 times the combined daily incidence of New York, New Jersey, and Connecticut.
Trump announced that "They don't test" in Europe, to answer why Europe had fewer cases. I wrote a reply to the Ralph Nader Hour, "That’s such an ignorant statement. On July 19 EU reported 3,090 new cases, the US reported over 63,000. In the EU people are not getting sick [blockhead! I should have included], so they are not getting tested. No amount of additional testing would bring up their numbers to a level close to the US. (“Our World in Data” had that data)." On April 26, almost 3 months ago, both the U.S. and the European Union had about the same number of cases, about 900,000. Between April 26 and August 2, the EU has added 530,000 and the U.S. 3,730,000 million -- 7 times more cases in the US than the EU in the past 3 month period. The U.S. loses control, Europe recovers.
(See Our World in Data, United States, Cumulative Confnirmed Cases.)
In mid April for two weeks the US had 142% more deaths than expected, or compared to the previous 3 years, shows this report from the CDC :
On week ending April 11, 142% in excess above expected —
Extrapolate that for yearly — 1.19 million more deaths, 42% more deaths
from norm of 2.839 million - add 1.19 m — gives 4.03 million.
Could that last for one full year? Could it be worse? Yes, of course.
Fortunately, social distancing and so on reduced the rate of transmission and daily death count.
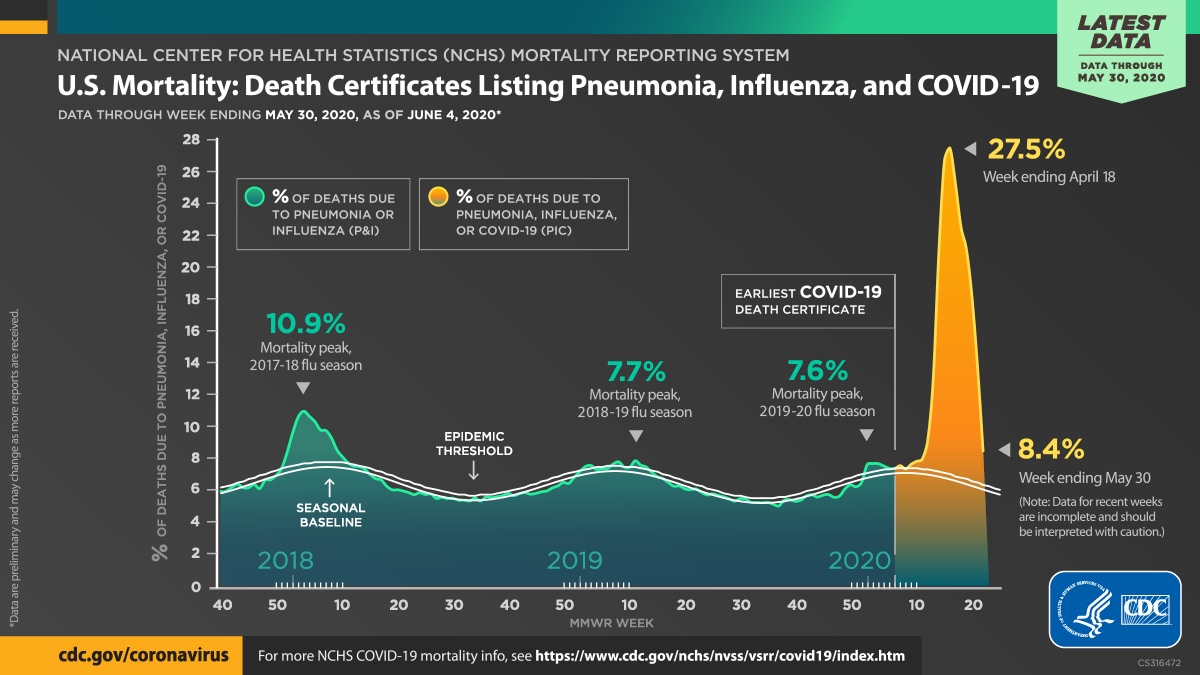
8.9% of all deaths this year are Covid-19 deaths, same CDC report.
Week ending 4/18 — 16,935 Covid-19 deaths, the peak (CDC report)
Week ending 7/5 — 3,297 deaths
Week ending 7/26 --- 6,200 deaths (shows the NY Times).
The John Hopkins daily situation report shows continued global surge of Covid-19.
Added content for July 19
Projected new cases for July -- 1.8 million.
April added 849 K, May added 725 K, June added 850 K.
Death rate is lowering, now at 3.8% of confirmed cases, was 6.0%.
African Americans, comprising 12.5% of U.S. population, account for 22.9% of deaths.
Whites (non-Hispanic) comprising 60.4% of population, account for 52.8% of deaths.
Age 65 and older make up 80% of deaths.
Nursing Homes deaths make up 24% of total deaths.
Excess deaths above expected normal was 36% to 41% on week ending April 11.
On week ending June 13 it had lowered to 3% to 6%.
"Percent of expected deaths" rises from 103% on week ending on March 21 to 142% on April 11, 3 weeks later. The recording of deaths is a slow process, lags behind actual deaths. If 140% of normal had maintained for a year, then 1,135,000 excess deaths would happen in 2020 or a year.
The U.S. has 23% of deaths and 26% of cases in the world, with below 5% of world population.
Added content for July 12
Two links -- Read the article about the possible spread of Covid-19 from University of California Berkeley. Early mitigations prevented millions of infections. For instance, total cases tripled in 9 days, from 107,321 to 330,891 between March 28 and April 6. What is the smartest move to make when a communicable disease is spreading at that rate? Other countries saw it coming and were prepared, read about Germany. More about this U.C. Berkeley study below.
See the content at Our World in Data, U.S., and scroll down to the graph "Cumulative Number of Covid-19 Cases" and add European Union. Then compare performance since April 26 when both had almost the same number of cases, 890,000 cases. By July 14 EU added 445,000 cases, U.S. added 2,470,000 cases. The U.S. added 5.5 times more cases than Europe since April 26. Both populations are roughly the same number of people, and have the same technology and healthcare expertise. Europeans have better health statistics than citizens of U.S., but only marginally better. Social distancing, facial masks, and avoiding confined spaces prevent transmission -- that is my conclusion, and others agree. Europe on July 14 has 1.29 million cases, U.S. has 3.36 million.
This week I did nothing but add new weekly case data to my long list below. Last week the U.S. nearly tripled its daily new cases average from six weeks ago; almost 60,000 were added each day last week, almost 20,000 daily six weeks ago. A disappointing reversal.
Added content for June 27
The lockdown --- Most important fact to consider.
The Washington Post, June 8, 2020, reported: “Shutdown orders prevented about 60 million novel coronavirus infections in the United States and 285 million in China, according to a research study published Monday that examined how stay-at-home orders and other restrictions limited the spread of the contagion.
----My comment: On June 7 the CDC reported 1,920,924 total Covid-19 cases in the U.S. -- therefore without lockdown there would have been 60 million plus. Believable? ---- 60 million is about 1 in 5 Americans.
A separate study from epidemiologists at Imperial College London estimated the shutdowns saved about 3.1 million lives in 11 European countries, including 500,000 in the United Kingdom, and dropped infection rates by an average of 82 percent, sufficient to drive the contagion well below epidemic levels.
---My comment: On June 28, UK reports 43,550 deaths at Worldometer.
The two reports, published simultaneously Monday in the journal Nature, used completely different methods to reach similar conclusions. They suggest that the aggressive and unprecedented shutdowns, which caused massive economic disruptions and job losses, were effective at halting the exponential spread of the novel coronavirus.”
““The disease was spreading at a really extraordinary rate that is rare even among very infectious diseases,” he said in an interview. The global response to covid-19, the disease caused by the virus, resulted in “saving more lives in a shorter period of time than ever before,” he said in a separate conference call with reporters.” The speaker is Solomon Hsiang, director of the Global Policy Laboratory at the University of California at Berkeley.
Comment: The U.S. experience in a short paragraph:
Governor of California orders shelter-in-place on March 19.
From the list I've maintained, well below, these conclusions
From March 29 to April 5, in 1 week, total cases tripled, from 100,000 to 300,000.
From April 5 to April 26, in 3 weeks, it triples again to 960,000. Tripling equals 200% increase.
From April 26 to May 17, in 3 weeks, total cases increase by 52%.
From May 17 to June 7, in 3 weeks, total cases increase by 31%.
From June 7 to June 28, in 3 weeks, cases increase by about 29%, from 1.92 mn to 2.48 mn.
The rate of spread is decreasing, but in the last three weeks not significantly.
World report from the WHO, from John Hopkins Center, June 24, Daily Situation Report
EPI UPDATE The WHO COVID-19 Situation Report for June 23 reports 8.99 million cases (133,326 new) and 469,587 deaths (3,847 new). The global daily incidence continues to exhibit an overall increasing trend. The global cumulative incidence surpassed 8 million cases on June 17, so it has only taken 6 days to reach 9 million cases. The following timeline illustrates the COVID-19 pandemic’s trajectory to date:
-Zero cases to 1 million cases : ~100 days
-1 million to 2 million cases : 12 days
-2 million to 3 million cases : 13 days
-3 million to 4 million cases : 12 days
-4 million to 5 million cases : 11 days
-5 million to 6 million cases : 10 days
-6 million to 7 million cases : 8 days
-7 million to 8 million cases : 8 days
-8 million to 9 million cases : 6 days
With a world population of 7.3 billion, 9 million is 0.12% of world population.
99.88% not infected with Covid-19
On June 14 I add another paragraph:
This last week, June 7 to June 14, the nation added only 142,908 new cases of Covid-19. This is the lowest weekly ‘new cases’ count in two months, since March 29 to April 5 when 225,987 ‘new cases’ were added to the total. A look below on this long blog post you'll see a subsection Weekly New Cases.
You'll see that for 4 weeks about 200,000 new cases were added each week. And then for 5 weeks about 165,000 new cases were added. Last week only 143,000 cases were added -- Progress.
Two months ago the nation added more ‘new cases’ than last week.
The list I have made, far below, shows new infections, and it shows that in one week at the end of March, total cases tripled -- in one week, increased by 214% (tripling) -- from 54,000 to 186,000. Try to imagine cases tripling every week for 2 months, 8 weeks. 1 - 3 - 9 - 27 - 81 - 243 - 729 - 2,187 - 6,561 --- that's 8 times. Now add five zeros onto each number -- end result, 656 million, or double the U.S. population. This past week, 7 days ending on June 14, we added fewer new cases than two months ago, the infection count increased by 7%. This is progress.
The name of the game is low increase of total infections, low rate of spread of contagion. Once we arrive at zero rate increase of infection, and keep it there for a month the pandemic in the U.S. is over.
In the week of March 29 to April 6 the count went from 105,000 to 331,000 — up by 226,000, an increase of 214%.
In the week June 7 to June 14 the count went went from 1.92 million to 2.06 million — up by 143,000, an increase of 7%. The increase of 143,000 was the lowest weekly increase since April 6.
The rate of infection is slowing, a very good sign.
I track the rate of infection increase.
See the blog: April 11 post, http://benl88.blogspot.com/
This last week, June 7 to 14, total infections increased by 7% — by 143,000.
In the week March 29 to April 6 total infections increased by 214% — by 226,000.
The picture: about 2 months ago (March 29) USA had 5% of total cases it had on June 7. There were about 105,000 on March 29 and 330,000 on April 5. On June 7 there were about 1,920,000 and on June 14 there were 2,063,000, an increase of 143,000. In the week after March 29 some 226,000 new cases were added.
Also -- A Washington Post article of June 8 cites two studies claiming that 60 million cases were prevented in the U.S. due to social distancing policies. One study from the University of California, Berkeley says that from March 2 to April 6, 37 days, the increase in cases in the U.S. was from 30 to 365,000, but without social distancing total cases would have been 5.1 million. By mid June at least 60 million cases would have resulted. The sacrifice of social distancing prevented an overwhelming health crisis. "A separate study from epidemiologists at Imperial College London estimated the shutdowns saved about 3.1 million lives in 11 European countries, including 500,000 in the United Kingdom, and dropped infection rates by an average of 82 percent, sufficient to drive the contagion well below epidemic levels."
Now, June 2, I add some more. Here are two summarizing statements to date:
1) During April the daily "average new cases" increase was about 29,000 each day, and in May it was about 21,000, and it is dropping steadily. In March total cases expanded by 7,000%, in April by 400%, in May by 77%. Get the picture? -- In March it went from 30 cases to 213,000 cases (a 7,000 times increase), in April it jumped to over 1 million (a 5 times increase), in May it added about 776,000 new cases (a 77% increase). The rate of expansion is about equal to the rate of danger. The goal is to get expansion to zero. If it stays at zero for about 2 or 3 weeks, the virus is extinct, inactive, no one to pass it on. It is tiresome to do the math, but you could match it all doing your own calculations.
2) Corona Virus update -- 20% more deaths nationally than normal - that is the conclusion of a NY Times article. In all of the U.S. from March 15 to May 2, a seven week period, there were 76,400 above-the-average extra deaths attributed to Covid-19 -- that's the conclusion of the NYTimes article. I did the math, it's a 20% increase in deaths over a 7 week period. Published today, June 1, this article reports excess deaths this year, between March 15 and April 2. -- -- It links to another article that reports a total of 76,400 extra deaths exceeding the average during the same 7 week period for years 2017, 2018, and 2019. You can do the math and check my results, the normal death count in US in 2018 was 2.782 million (US Center for Vital Statistics). The biggest question is why did the spread of Covid-19 slow down? Was it social distancing mandates, or was it because all viruses poop out after a short rash of infection? On March 15 there were 2,234 cases nationwide, and seven weeks later, May 2, there were 1,092,815 cases. Wildfire, it was spreading like a forest fire in Montana racing up a ravine on a hot September afternoon. Let's imagine another study: let us imagine there were no social-distancing regulations, and Covid-19 spread AT The SAME RATE for another 7 weeks, and by June 14 all citizens would be infected. What then would be the number of extra deaths? That would be a scorcher. I wonder about all the conjectures related to "was social distancing necessary?" There is a strong case that it wasn't needed. But then you look at New York City, where they experienced 7 times the normal deaths during that 7 week period -- 26,000 excess deaths this linked-to article states. Normally they expected 3,700 deaths, they had 26,000 (that's a 2 month period, the article states). And then there is the story of a church choir holding practice for 2.5 hours, and of the 61 attending, 52 had symptomatic cases of Covid-19, far higher than is reported in other mass surveys. It is a mysterious disease, and playing safe with it may have saved 100,000s of additional deaths. All the numbers befuddle us, for sure. Each one is a dead human in this case.
___________________________________________________________
The highlight is that the Covid-19 is unpredictable, and very infectious, transmission is rapid if all restraints are removed. Note how rapid it increased in March, even though the "shelter-in-place" order happened on March 19.
On March 1 there were 30 cases, on April 1 there were 213,144 in the U.S.
July 1 -- actual count 2,637,834 -- see the long lists below
On March 1 there were 30 cases, on April 1 there were 213,144 in the U.S.
January 22 1 case. in a week cases increase by 8 times
Feb. 1 — 8 cases in February cases increase by 4 times to 30.
March 1 — 30 cases in March cases increase by 7,105 times more than March 1
April 1 — 213,144 cases in April cases increase by 5 times
May 1 — 1,050,000 cases in May
it looks like cases will increase from 1 million to 1.8 million, 80%.
June 1 -- prediction: 1.8 million U.S. cases -- Actual count = 1,776,293July 1 -- actual count 2,637,834 -- see the long lists below
I have a long list below recording the daily new infection count, total cases count, the fatality count, and the Case Fatality Rate (CFR), a percentage. I keep adding almost daily (now weekly). At worst infection transmission would have infected all 329 million Americans by June 1, causing 3.3 million deaths or 1% of U.S. population, my worst prediction. The Imperial College worst projection posited 2.2 million, that without any mitigations. It won't happen, but how do you explain total cases expanding by a factor of 7,105 (for 30 to over 213,000) in just one month, March, from 30 to 213,144 cases? How do you explain that Japan has 5 deaths per 1 million, the U.S. 232/mn, and Belgium 726/mn? (See Worldometer, Corona Virus, May 7) The CDC recently published a graph showing Covid-19 deaths were 24.8% of all deaths in the week April 4 to 11.
At that rate for a year there would be over 700,000 U.S. deaths from Covid-19. You can see the following 2 weeks, ending April 25 Covid deaths as a percentage of all deaths had dropped to 14.6%, probably a consequence of social distancing.
Two interviews with experts are very informative:
The Ralph Nader Radio Hour talked with Dr. Michael Osterholm, "a professor and director of the Center for Infectious Disease Research and Policy at the University of Minnesota. He is the author of the 2017 book, “Deadliest Enemy: Our War Against Killer Germs”."
Perhaps the world winner in containing Covid-19 is the Indian state of Kerala. An article at The Guardian explains how in May they kept deaths to 4 and total cases to 524 in a population of 38 million; an equal population to California with 3,000 deaths and about 75,000 cases, or the U.K. with 34,000 deaths and 236,000 cases on May 15. A radio interview with Vijay Prashad explains in more detail the cultural response in Kerala that crushed the epidemic (see April 23 interview).
Another good interview, it goes at the top: Pitchfork Economics has an interview with the man who in 2014 served the Obama administration as the Ebola Response Coordinator, Ronald Klain. The central idea is "this pain was not inevitable, the damage could have been much lower". Klain saw the Covid-19 pandemic coming, and in 2016 he wrote an article "Confronting the Pandemic Threat" in Democracy Journal. A 37 minute discussion. From the 2016 article: “The next President must act from Day One to prepare for that threat: If she or he waits until grim-faced aides file into the Oval Office to explain that a pandemic is unfolding, it will be far too late to save countless people around the world, protect our interests abroad, and preserve lives here at home.”
From April 1 to April 24 the number of "new cases" seems to be a steady 29,000 added cases per day. Check the long list below at this blog. We are waiting for that "new cases" number to decrease before easing the shelter-in-place order.
How bad will it get? Predicting -----
The New York Times has a web page devoted to the Covid-19 disease. Many relevant comparisons are there, especially "confirmed cases per 100,000". Also it carries multiple stories elsewhere.
It's very difficult to predict how bad. In Japan they have had 3 deaths per 1,000,000 says the Worldometer records. The U.S. has had 218/million, and in Belgium they have had 692/million, and in the Influenza Epidemic of 1918 in the U.S. there were 6500 deaths/million (675,000 out of a population of 104 million -- 6,500 times 104 equals 676,000). Luck, social response, government actions, old age, crowded conditions, weather all factor in.
In April it looks like Covid-19 cases will comprise 20% of all deaths, says USA Facts. If that death rate continues, then 567,000 deaths will occur (but not all in one year). 567,000 divided by 2,839,000 normal deaths equals 20% more deaths.
The CDC shows the daily new cases, and since January the total cases and the death count. I show the same below in a long list. The prison testing report could easily reflect the national trend. In the prisons surprisingly they found only 4% are symptomatic cases, and 96% asymptomatic. If that proves to be the national ratio, then of the 330 million U.S. population only 4% (13.2 million) will have "confirmed" cases. Of that 13.2 million only 20% (2.64 million) will have serious cases, and of the 2.64 million only 5.8% will die, then out of 330 million 153,120 will die. This is 5% more deaths than normally expected.
Or let's look at this possibility: perhaps 96% will always be asymptomatic and 4% will have symptoms. On May 6 we have 1.2 million confirmed cases (the 4%), and 70,000 deaths (the 5.8%). That implies we have another 28.8 million asymptomatic infections (96% are asymptomatic) and 4% are symptomatic, or 1.2 million "confirmed cases". Together there are 30 million infected, which is only 9% of total U.S. population. With just 9% infected and 70,000 deaths already, then when all 330 million citizens are infected there will be 11 times 70,000 deaths, 770,000 total deaths. This is 27% more deaths than normally expected. --- 153,120 or 770,000? (15 times 5 = 75)
Will we have 5% or 27% more deaths than expected? What is it? This is why we need the antibody tests to assess the percentage infected. Will 96% be infected and asymptomatic nationwide? For me prediction is a shot in the dark.
In 2018 2,839,205 deaths from all causes occurred, and an added 770,000 is about a 27% increase. We have 55,258 deaths as of April 29, so we are doing better than expected. It looks like the prediction of 153,000 deaths is closed to the present trend.
An explanation that U.S. annual deaths will increase by 25% in 2020 Prison officials in 4 states administered 4,693 tests, and 70% turned out positive (3,277 cases), but surprisingly 96% of the positive responses were asymptomatic, and only 4% (or 188) were symptomatic cases. Logically all 100% inmates will eventually be infected over time. Nationally, if only 4% of the U.S. population is infected with symptoms, 13.2 million, and the Case Fatality Rate continues to be 5.6%, then approximately 739,000 deaths will result from Covid-19, but it may take 18 months or more. This would increase the yearly death count by 25%, from 2.8 million to 3.5 million. If only 70% of the population is infected the ultimate death count will be 535,000. The prisons involved were in Ohio, Arkansas, North Carolina, and Virginia says this article at Axios. Knowledge of this asymptomatic result lowers the ultimate death count considerably, but it is still very high. I suspected the death count could approach 3.3 million, 1% of the nation. One very professional prediction from the Imperial College projected 2.2 million. This would equal the mortality rate of the 1918 influenza epidemic. If it happened once, it could happen twice. The 2.2 million figure was a projection of no-mitigation, let the wildfire burn everything. Also, Axios reports that Covid-19 will produce around 46,000 deaths in April, which will be the third leading cause in April for all deaths behind heart disease and cancer, each of which produce around 50,000 deaths monthly. On April 24 and 25 each day created 2,010 deaths, while the average for heart disease is 1,774 and for cancer is 1,641 says this Newsweek article. Reuters News carries a matching and longer article about the prison results. Today is April 26.
A testing inventory of all locations, a national survey, is an important tool still needed to understand how deadly this virus is.
On April 29 the WHO reports a global CFR of 6.8%, that is about 200,000 deaths following about 3 million confirmed cases. The U.S. has a 5.6% CFR, but it may rise.
Worldometer reports for Sweden 224 deaths/million, and for U.S. 183/million, for Spain 519/million, for April 29. If the US had Sweden's death rate, instead of 60,000 dead there would be 80,000. German, Canada, Austria, Denmark, Poland, Japan, South Korea, Australia, New Zealand, China and Russia have done much better than Sweden. In the U.S. in 1919 the deaths/million was 6,750, much higher, 30 times higher, than the Covid-19, so far. We have had it for 3 months, in 1919 it ran for 18 months. Face masks were mandatory in 1919.
John Hopkins University has an excellent data center.
Business Insider carried on April 14 an article on death rates and mortality rates.
This New York Times article explains the intricacies, April 14. I am amazed the author put it all together. It is a complicated issue, and this author uncovers how intricate it is.
The Virology Blog has the best article about the Infection Fatality Rate, and a promising antibody test, April 5.
Nicholas Kristof at NYTimes shows his talents in this March 20 article, portraying the best and worst outcomes.
The NPR (National Public Radio) posted this article on models predicting mortality rates. The most severe model predicts 1,811,000 deaths. In 2018 the total number of deaths from all causes was 2.8 million. Transmission and mortality rates are not clearly known, and that determines everything, the portion of the population infected is unknown, and the deadliness of the disease is unknown. As I have said below, perhaps 1% of the population will die, 3,270,000 deaths. No one knows.
USA Facts publishes a map showing the case numbers in each USA county. Rockland County New York, has a count of 3,097 per 100,000, which is also 3.1% of the county, 1 in 33 residents, as of April 24. If all counties had that portion infected, then the death toll for the U.S. at 5.6% would be about 550,000 deaths. Another USA Facts article shows Covid-19 deaths as third leading cause of death in April, with about 46,000 projected deaths, below the about 50,000 for both heart disease and cancer.
The USA Fact maps and charts seem to be the best current scorekeeper.
The CFR is the death rate of confirmed cases.
The IFR is the death rate of all cases including asymptomatic cases, a very big unknown.
The "mortality rate" is the death count divided by the national population, usually expressed as deaths per 100,000.
I'm mostly concerned about how bad it will get in the U.S. How bad will be determined by the rate of infection spread and the rate of death in the entire population, the mortality rate. In the past 33 days the infection count has increased by a factor of 100. This is explosive growth. In 33 days infections have increased from 7,023 cases to over 700,000 cases; that is a 100 times more in 33 days. The CDC reports daily on new cases. Why is infection growth slowing? It should be obvious.
The explosive growth would continue without the social distancing rules. The case fatality rate (CFR) shows how many with confirmed diagnosis died. The CFR will be higher than the infection fatality rate (IFR) because the IFR includes mild, moderate or asymptomatic cases not recorded or confirmed -- the big or small unknown. And the mortality rate will be lower than the IFR -- some people will not be infected, probably but not for certain. The European nations are doing much worse, 2, 3 and 4 times worse with the mortality rate per 100,000 of population in Belgium, Netherlands, France, the U.K., Italy and Spain. You can look at the WHO daily Situation Reports or the John Hopkins tables and graphs. John Hopkins publishes its own daily Situation Report, very informative with news from world over. I guess that more people go to the doctor without waiting in these European countries, but widespread accurate diagnosis and early treatment only raises the mortality rate. Some U.S. deaths may be wrongly attributed to pneumonia due to lack of testing. These European countries have the best health care systems in the world. Not until testing and antibody testing is available -- reliable, quick and widely distributed -- will the IFR be meaningful.
On March 19 California governor Gavin Newsom declared a shelter-in-place order. There were nationally 15,219 cases reported. But two days previous there were 7,023 cases, reports the CDC daily updated report. Since March 17, one month and 2 days later, April 19, John Hopkins reports 722,761 cases, an increase of 103 times. But a month prior, between February 22 and March 22 the case count expanded by a factor of 2,227, dazzlingly explosive, from 15 cases to 33,404. The 15 on February 15 was in reality more like 150 or more. Even with social distancing and sheltering measures (called mitigations), the case load exploded after March 19. On April 1 the rate of new cases stabilized to an average of about 29,000 per day.
Looking to May 19, a month into the future, 36.5 million cases could be waiting for treatment, hard to believe. Between March 19 to April 19 the case load exploded from 15,219 to 746,625, an explosion of 49 times in one month. I will do the simple math: 15K times 49 equals 745K, and 746,625 accurately. Then multiply 746,625 by 49, which equals 36 million, one in 9 Americans. By June 19 the entire nation is easily infected. Let's say 20% are serious, severe or critical, and 5% die, then we have 1% of the nation deceased, 3.3 million just three months from now, July 19. The accuracy of the March 19 figure is pretty good, and that is when California governor Gavin Newsom declared a shelter-in-place rule. So mitigation measures, social distancing, were in place during the 49 times month. The expansion rate February to March was 2,227 times, but the data is not believable. Since the virus did actually expand 50 times in one month, why not the next month? Such a future would overwhelm the health system. Social distancing is necessary to avoid catastrophic death counts.
And presently our CFR is 5.0%. That does not mean 5% of the nation will die, 16 million. It may mean 45 million (13.8%) will develop a serious case, and of that number 5% will die, 2.2 million. The WHO data base states that France's CFR death rate is 17.0%, the worse statistical rate I have seen. The John Hopkins rate for France, same date, is 12.5%. The U.S. CFR rate was 3.8% on April 13, and now it is 5.2%, April 20. Data is not uniform, and rates change. The outcome is uncertain.
____________________________________________________________
Here is a listing from the CDC on case increases since April 17
4/18 29,002 690,714 35,443 5.1%
4/27 18,755 962,491 55,258 5.6% Cases Double from 4/11
4/28 23,459 981,246
4/29 23,901 1,005,147
4/30 26,512 1,031,659 60,057 5.8%
See this CDC page for an accurate new cases number.
5/1 guess -------1,030,000 1 month since leveling off
2 months -- from March 1st to May 1st, from 30 to 1 million cases !
1 month -- from April 1st to May 1st, from 186,101 to 1,062,446 cases !
Cases increase by 5.7 times in one month with "social distancing" in force. This virus
spreads rapidly even with national distancing in force. The death count is difficult
to ascertain because of 2 week lag in reporting from jurisdictions, and I cannot find
the April 1 total Covid-19 death count . But it no doubt tripled in 3 weeks since April 10.
Following the increase in percentage of deaths from total cases is indicative.
5/1 30,787 1,062,446 62,446 5.9%
5/2 30,369 1,092,815 64,283 5.9% 9 weeks after 3/1 with 30 cases
5/3 29,671 1,122,486 65,735 5.9% Sunday
daily average of 27,712 new confirmed cases 4/26 to 5/3
5/4 29,763 1,152,249
5/5 19,138 1,171,510 68,279 5.8%
5/6 22,303 1,193,813 70,802 5.9%
5/7 25,253 1,219,066 73,297 6.0%
5/8 28,974 1,248,040 75,477 6.0%
5/9 25,996 1,274,036 77,034 6.0%
5/10 26,660 1,300,696 78,771 6.1% 10 weeks after 3/1 Sunday
daily average of 25,489 new confirmed cases between 5/3 and 5/10
5/11 23,792 1,324,792
5/12 18,106 1,342,594 80,820 6.0%
5/13 21,467 1,364,061 82,246 6.0%
5/14 20,869 1,384,930 83,947 6.1%
5/15 27,191 1,412,121 85,990 6.1%
5/16 22,977 1,435,098 87,315 6.1%
5/17 31,967 1,467,065 88,709 6.0% 11 weeks after 3/1 Sunday
daily average of 23,761 new confirmed cases between 5/10 and 5/17
5/24 1,622,114 97,049 6.0% 12 weeks after 3/1 Sunday
daily average of 22,150 new confirmed cases between 5/17 to 5/24
5/31 1,761,503 103,700 5.9%
daily average of 19,913 new confirmed cases between 5/24 to 5/31
June 1 -- about a 78% of new cases over a 30 day period, since May 1.
Quite a slow down from March 1 to April 1, an increase from 30 to 303,000.
At this rate it will take to September 13, 2020 to reach ZERO no new cases.
6/7 1,920,924 109,901 5.7%
Case increases began at 10,270 a day on 3/24 and doubled within 6 days.
In Three Months, from One to 809,000
In April it looks like Covid-19 cases will comprise 20% of all deaths, says USA Facts. If that death rate continues, then 567,000 deaths will occur (but not all in one year). 567,000 divided by 2,839,000 normal deaths equals 20% more deaths.
The CDC shows the daily new cases, and since January the total cases and the death count. I show the same below in a long list. The prison testing report could easily reflect the national trend. In the prisons surprisingly they found only 4% are symptomatic cases, and 96% asymptomatic. If that proves to be the national ratio, then of the 330 million U.S. population only 4% (13.2 million) will have "confirmed" cases. Of that 13.2 million only 20% (2.64 million) will have serious cases, and of the 2.64 million only 5.8% will die, then out of 330 million 153,120 will die. This is 5% more deaths than normally expected.
Or let's look at this possibility: perhaps 96% will always be asymptomatic and 4% will have symptoms. On May 6 we have 1.2 million confirmed cases (the 4%), and 70,000 deaths (the 5.8%). That implies we have another 28.8 million asymptomatic infections (96% are asymptomatic) and 4% are symptomatic, or 1.2 million "confirmed cases". Together there are 30 million infected, which is only 9% of total U.S. population. With just 9% infected and 70,000 deaths already, then when all 330 million citizens are infected there will be 11 times 70,000 deaths, 770,000 total deaths. This is 27% more deaths than normally expected. --- 153,120 or 770,000? (15 times 5 = 75)
Will we have 5% or 27% more deaths than expected? What is it? This is why we need the antibody tests to assess the percentage infected. Will 96% be infected and asymptomatic nationwide? For me prediction is a shot in the dark.
In 2018 2,839,205 deaths from all causes occurred, and an added 770,000 is about a 27% increase. We have 55,258 deaths as of April 29, so we are doing better than expected. It looks like the prediction of 153,000 deaths is closed to the present trend.
An explanation that U.S. annual deaths will increase by 25% in 2020 Prison officials in 4 states administered 4,693 tests, and 70% turned out positive (3,277 cases), but surprisingly 96% of the positive responses were asymptomatic, and only 4% (or 188) were symptomatic cases. Logically all 100% inmates will eventually be infected over time. Nationally, if only 4% of the U.S. population is infected with symptoms, 13.2 million, and the Case Fatality Rate continues to be 5.6%, then approximately 739,000 deaths will result from Covid-19, but it may take 18 months or more. This would increase the yearly death count by 25%, from 2.8 million to 3.5 million. If only 70% of the population is infected the ultimate death count will be 535,000. The prisons involved were in Ohio, Arkansas, North Carolina, and Virginia says this article at Axios. Knowledge of this asymptomatic result lowers the ultimate death count considerably, but it is still very high. I suspected the death count could approach 3.3 million, 1% of the nation. One very professional prediction from the Imperial College projected 2.2 million. This would equal the mortality rate of the 1918 influenza epidemic. If it happened once, it could happen twice. The 2.2 million figure was a projection of no-mitigation, let the wildfire burn everything. Also, Axios reports that Covid-19 will produce around 46,000 deaths in April, which will be the third leading cause in April for all deaths behind heart disease and cancer, each of which produce around 50,000 deaths monthly. On April 24 and 25 each day created 2,010 deaths, while the average for heart disease is 1,774 and for cancer is 1,641 says this Newsweek article. Reuters News carries a matching and longer article about the prison results. Today is April 26.
A testing inventory of all locations, a national survey, is an important tool still needed to understand how deadly this virus is.
On April 29 the WHO reports a global CFR of 6.8%, that is about 200,000 deaths following about 3 million confirmed cases. The U.S. has a 5.6% CFR, but it may rise.
Worldometer reports for Sweden 224 deaths/million, and for U.S. 183/million, for Spain 519/million, for April 29. If the US had Sweden's death rate, instead of 60,000 dead there would be 80,000. German, Canada, Austria, Denmark, Poland, Japan, South Korea, Australia, New Zealand, China and Russia have done much better than Sweden. In the U.S. in 1919 the deaths/million was 6,750, much higher, 30 times higher, than the Covid-19, so far. We have had it for 3 months, in 1919 it ran for 18 months. Face masks were mandatory in 1919.
John Hopkins University has an excellent data center.
Business Insider carried on April 14 an article on death rates and mortality rates.
This New York Times article explains the intricacies, April 14. I am amazed the author put it all together. It is a complicated issue, and this author uncovers how intricate it is.
The Virology Blog has the best article about the Infection Fatality Rate, and a promising antibody test, April 5.
Nicholas Kristof at NYTimes shows his talents in this March 20 article, portraying the best and worst outcomes.
The NPR (National Public Radio) posted this article on models predicting mortality rates. The most severe model predicts 1,811,000 deaths. In 2018 the total number of deaths from all causes was 2.8 million. Transmission and mortality rates are not clearly known, and that determines everything, the portion of the population infected is unknown, and the deadliness of the disease is unknown. As I have said below, perhaps 1% of the population will die, 3,270,000 deaths. No one knows.
USA Facts publishes a map showing the case numbers in each USA county. Rockland County New York, has a count of 3,097 per 100,000, which is also 3.1% of the county, 1 in 33 residents, as of April 24. If all counties had that portion infected, then the death toll for the U.S. at 5.6% would be about 550,000 deaths. Another USA Facts article shows Covid-19 deaths as third leading cause of death in April, with about 46,000 projected deaths, below the about 50,000 for both heart disease and cancer.
The USA Fact maps and charts seem to be the best current scorekeeper.
The CFR is the death rate of confirmed cases.
The IFR is the death rate of all cases including asymptomatic cases, a very big unknown.
The "mortality rate" is the death count divided by the national population, usually expressed as deaths per 100,000.
I'm mostly concerned about how bad it will get in the U.S. How bad will be determined by the rate of infection spread and the rate of death in the entire population, the mortality rate. In the past 33 days the infection count has increased by a factor of 100. This is explosive growth. In 33 days infections have increased from 7,023 cases to over 700,000 cases; that is a 100 times more in 33 days. The CDC reports daily on new cases. Why is infection growth slowing? It should be obvious.
The explosive growth would continue without the social distancing rules. The case fatality rate (CFR) shows how many with confirmed diagnosis died. The CFR will be higher than the infection fatality rate (IFR) because the IFR includes mild, moderate or asymptomatic cases not recorded or confirmed -- the big or small unknown. And the mortality rate will be lower than the IFR -- some people will not be infected, probably but not for certain. The European nations are doing much worse, 2, 3 and 4 times worse with the mortality rate per 100,000 of population in Belgium, Netherlands, France, the U.K., Italy and Spain. You can look at the WHO daily Situation Reports or the John Hopkins tables and graphs. John Hopkins publishes its own daily Situation Report, very informative with news from world over. I guess that more people go to the doctor without waiting in these European countries, but widespread accurate diagnosis and early treatment only raises the mortality rate. Some U.S. deaths may be wrongly attributed to pneumonia due to lack of testing. These European countries have the best health care systems in the world. Not until testing and antibody testing is available -- reliable, quick and widely distributed -- will the IFR be meaningful.
On March 19 California governor Gavin Newsom declared a shelter-in-place order. There were nationally 15,219 cases reported. But two days previous there were 7,023 cases, reports the CDC daily updated report. Since March 17, one month and 2 days later, April 19, John Hopkins reports 722,761 cases, an increase of 103 times. But a month prior, between February 22 and March 22 the case count expanded by a factor of 2,227, dazzlingly explosive, from 15 cases to 33,404. The 15 on February 15 was in reality more like 150 or more. Even with social distancing and sheltering measures (called mitigations), the case load exploded after March 19. On April 1 the rate of new cases stabilized to an average of about 29,000 per day.
Looking to May 19, a month into the future, 36.5 million cases could be waiting for treatment, hard to believe. Between March 19 to April 19 the case load exploded from 15,219 to 746,625, an explosion of 49 times in one month. I will do the simple math: 15K times 49 equals 745K, and 746,625 accurately. Then multiply 746,625 by 49, which equals 36 million, one in 9 Americans. By June 19 the entire nation is easily infected. Let's say 20% are serious, severe or critical, and 5% die, then we have 1% of the nation deceased, 3.3 million just three months from now, July 19. The accuracy of the March 19 figure is pretty good, and that is when California governor Gavin Newsom declared a shelter-in-place rule. So mitigation measures, social distancing, were in place during the 49 times month. The expansion rate February to March was 2,227 times, but the data is not believable. Since the virus did actually expand 50 times in one month, why not the next month? Such a future would overwhelm the health system. Social distancing is necessary to avoid catastrophic death counts.
And presently our CFR is 5.0%. That does not mean 5% of the nation will die, 16 million. It may mean 45 million (13.8%) will develop a serious case, and of that number 5% will die, 2.2 million. The WHO data base states that France's CFR death rate is 17.0%, the worse statistical rate I have seen. The John Hopkins rate for France, same date, is 12.5%. The U.S. CFR rate was 3.8% on April 13, and now it is 5.2%, April 20. Data is not uniform, and rates change. The outcome is uncertain.
____________________________________________________________
Here is a listing from the CDC on case increases since April 17
The course of infection increase as reported by the CDC, Center of Disease Control and Prevention:
Date Daily Newly Total Case
Infected Infected Fatalities Fatality Rate
3/18 2,797 7,023
3/19 3,419 10,442
3/20 4,777 15,219 Governor Newsom declares Shelter in Place
3/21 3,528 18,747
daily average of 3,192 new confirmed cases in past week
3/22 5,836 24,583
3/23 8,821 33,404
3/24 10,934 44,338
3/25 10,270 54,453
3/26 13,987 68,440
3/27 16,916 85,386
3/28 17,965 107,321
daily average of 15,357 new confirmed cases in past week
3/29 19,332 122,653
3/30 18,251 140,904
3/31 22,635 163,539
4/1 22,562 186,101
4/2 27,043 213,144 Daily-New-Cases begins to level off or plateau
4/3 26,061 239,279 Cases count doubles in 5 days
4/4 37,926 277,205
4/5 27,061 304,826
daily average of 27,141 new confirmed cases in past week
4/6 26,065 330,891 Easter Sunday - President had predicted re-opening economy
4/7 43,438 374,329
4/8 20,682 395,926
4/9 32,449 427,460
4/10 31,705 459,165
4/11 33,251 492,416 Case CFR Cases Doubles from 4/2
4/12 33,288 525,704 Fatalities
daily average of 31,994 new confirmed cases in past week
daily average is 10 times the average of 3 weeks previous, week ending 3/21
Daily Average TEN TIMES MORE THAN THREE WEEKS AGO !!!
Perhaps testing increased, or perhaps more were sick, or both.
Let's imagine 10 times increase every 3 weeks.
By what date are 330 million infected?
Answer -- June 14, 2020.
This is why the study by the University of California, Berkeley, is so profoundly important.
They said that by April 6, instead of 356,000 infected cases it could have been 5,100,000 cases.
4/13 29,145 554,849
4/14 24,156 579,005 22,252 3.8%
4/15 26,385 605,390 24,582 4.1%
4/16 27,158 632,548 31,071 4.9%
4/17 29,164 661,712 33,049 5.0%
4/18 29,002 690,714 35,443 5.1%
4/19 29,916 720,630 37,220 5.2%
daily average of 27,396 new confirmed cases in past week
4/20 25,995 746,625 39,083 5.2%
4/21 29,468 776,093 41,758 5.4%
4/22 26,490 802,583 44,574 5.6% -- death count doubles in 8 days
4/23 25,858 828,441 46,379 5.6% 3 months after case 1 on 1/22/20
4/24 37,144 865,585
4/24 30,181 895,766 50,439 5.6%
4/25 29,256 928,619 52,459 5.6%
4/26 33,872 957,875
4/22 26,490 802,583 44,574 5.6% -- death count doubles in 8 days
4/23 25,858 828,441 46,379 5.6% 3 months after case 1 on 1/22/20
4/24 37,144 865,585
4/24 30,181 895,766 50,439 5.6%
4/25 29,256 928,619 52,459 5.6%
4/26 33,872 957,875
daily average of 30,616 new confirmed cases in past week
4/27 18,755 962,491 55,258 5.6% Cases Double from 4/11
4/28 23,459 981,246
4/29 23,901 1,005,147
4/30 26,512 1,031,659 60,057 5.8%
See this CDC page for an accurate new cases number.
5/1 guess -------1,030,000 1 month since leveling off
2 months -- from March 1st to May 1st, from 30 to 1 million cases !
1 month -- from April 1st to May 1st, from 186,101 to 1,062,446 cases !
Cases increase by 5.7 times in one month with "social distancing" in force. This virus
spreads rapidly even with national distancing in force. The death count is difficult
to ascertain because of 2 week lag in reporting from jurisdictions, and I cannot find
the April 1 total Covid-19 death count . But it no doubt tripled in 3 weeks since April 10.
Following the increase in percentage of deaths from total cases is indicative.
5/1 30,787 1,062,446 62,446 5.9%
5/2 30,369 1,092,815 64,283 5.9% 9 weeks after 3/1 with 30 cases
5/3 29,671 1,122,486 65,735 5.9% Sunday
daily average of 27,712 new confirmed cases 4/26 to 5/3
5/4 29,763 1,152,249
5/5 19,138 1,171,510 68,279 5.8%
5/6 22,303 1,193,813 70,802 5.9%
5/7 25,253 1,219,066 73,297 6.0%
5/8 28,974 1,248,040 75,477 6.0%
5/9 25,996 1,274,036 77,034 6.0%
5/10 26,660 1,300,696 78,771 6.1% 10 weeks after 3/1 Sunday
daily average of 25,489 new confirmed cases between 5/3 and 5/10
5/11 23,792 1,324,792
5/12 18,106 1,342,594 80,820 6.0%
5/13 21,467 1,364,061 82,246 6.0%
5/14 20,869 1,384,930 83,947 6.1%
5/15 27,191 1,412,121 85,990 6.1%
5/16 22,977 1,435,098 87,315 6.1%
5/17 31,967 1,467,065 88,709 6.0% 11 weeks after 3/1 Sunday
daily average of 23,761 new confirmed cases between 5/10 and 5/17
5/24 1,622,114 97,049 6.0% 12 weeks after 3/1 Sunday
daily average of 22,150 new confirmed cases between 5/17 to 5/24
5/31 1,761,503 103,700 5.9%
daily average of 19,913 new confirmed cases between 5/24 to 5/31
June 1 -- about a 78% of new cases over a 30 day period, since May 1.
Quite a slow down from March 1 to April 1, an increase from 30 to 303,000.
At this rate it will take to September 13, 2020 to reach ZERO no new cases.
6/7 1,920,924 109,901 5.7%
daily average of 22,774 new confirmed cases between 5/31 and 6/7
cases per day creep upwards, a reversal -- bad news
6/14 2,063,812 115,271 5.6%
daily average of 20,412 new confirmed cases between 6/7 and 6/14
weekly increase - 142,888
6/21 2,248,049 119,615 5.3%
daily average of 26,320 new confirmed cases between 6/14 and 6/21
weekly increase - 184,237 -- 728 deaths/day ave.
weekly increase - 184,237 -- 728 deaths/day ave.
6/28 ---------------- 2,504,193 ---------
daily average of 36,592 new confirmed cases between 6/21 and 6/28
weekly increase - 256,144
7/5 ---------------- 2,886,267 cases --- 129,811 deaths --- 4.5% CFR, case fatality rate
daily average of 48,671 new confirmed cases between 6/28 and 7/5
weekly increase 382,074
7/12 daily average of 58,618 new confirmed cases between 7/5 and 7/12
weekly increase 410,326
---------------------- 3,296,599 total cases --- 134,884 deaths -- 4.1% CFR, 742 deaths/day
almost triple the week ending May 31, which is 6 weeks ago, --- 19,913 average daily that week
Georgia Governor Brian Kemp, May 20, announces opening of economy --
If rate triples in six more weeks, then weekly 1.2 million / week will be the case.
Our World in Data is the gold standard in reporting, see here.
7/19 Sunday daily average of 66,400 new confirmed cases between 7/12 and 7/19
weekly increase 464,800 triple from 5 weeks ago
--------------------- 3,698,161 total cases --- 139,659 deaths -- 3.8% CFR -- 682 deaths/day
7/26 daily average of 66,332 new confirmed cases between 7/19 and 7/26
weekly increase 464,324 -- same as last week
---------------------- 4,225,687 total cases -- 146,546 deaths -- 3.5% CFR - 983 deaths/day
8/2 daily average of 60,488 new confirmed cases between 7/26 and 8/2
weekly increase 423,416 -- triple that of 7 weeks ago
---------------------- 4,649,102 total cases, -- 154,471 deaths -- 3.3% CFR -- 1,132 deaths / day
8/9 daily average of 52,507 new confirmed cases between 8/2 and 8/9
5,023,649 total cases -- 161,842 deaths 7,371 in 7 days, 1,053 per day
weekly increase 374,549 -- 3.2% CFR
8/16 daily average of 51,211 new confirmed cases between 8/9 and 8/16
5,382,125 total cases -- 169,350 deaths 7,508 in 7 days -- 1,072 per day
weekly increase 358,476 -- CFR 3.1%
8/23 daily average of 42,909 new confirmed cases between 8º16 and 8º23
5,683,012 total cases -- 176,217 deaths 6,867 in 7 days -- 981 per day
weekly increase 300,363 -- CFR 3.1%
8/30 daily average of 42,082 new confirmed cases between 8/23 and 8/30
5,977,586 total cases --- 182,510 deaths 6,293 in 7 days -- 899 per day
weekly increase 294,574 -- CFR 3.1%
Ten weeks ago weekly increase was 256,000.
9/6/20 daily average of 40,867 new confirmed cases between 8/30 and 9/6
6,263,655 total cases --- 188,306 deaths 5,796 in last 7 days -- 828 per day weekly increase 286,069 -- CFR 3.0%
9/13 daily average of 35,065 new confirmed cases between 9/6 and 9/13
6,509,110 total cases --- 193,444 deaths 5,138 in last 7 days -- 734 per day weekly increase 245,455 -- CFR 3.0%
9/20 daily average of 41,101 new confirmed cases between 9/13 and 9/20
6,825,700 total cases --- 199,300 deaths 4,300 in last 7 days -- 773 per day UP AGAIN -- see the graph at NY Times
weekly increase 287,707 -- CFR 2.9% A NEW LOW
9/27 daily average of 43,111 new confirmed cases between 9/20 and 9/27
7,195,900 total cases (reports the NYTimes) 204,888 deaths 5,236 in last 7 days -- 748 per day
weekly increase 301,777 -- CFR 2.8% A NEW LOW
___________________________________________________________
The New York Times has an excellent graph page showing new cases and total case history for all 50 states and some U.S. property such as Guam and Puerto Rico. And Links Medicus also shows a list of articles to chose from.
Each week the percentage of new cases is lower.
By about May 15 we will stall, no more new cases.
_________________________________
March 31 to April 6, cases double, from 186,101 to 374,329.
If cases double every week, in 11 weeks, by July 17, all 330 million Americans are infected,
assuming cases double every week. Is that "no big deal"? Out of every 100, 20 cases are serious, and 5% of the 20 die, that would be 1 death per 100 Americans die by June 17, total Covid-19 death count 3.3 million . This doubles the annual death count from all causes. Not possible?
Normal death count in 2018 was 2.8 million. This is not an emergency?
The annual death count could double this year. My first paragraph above is less shocking.
From April 1 to April 19 daily increase of cases averages around 29,000 per day, plateauing.
California declares “shelter in place” on March 19.
After an insomniac night doing numbers while trying to conciliate sleep I discovered the big deal.
The big deal is the rate of increase from day to day, week to week, and month to month.
CASE INCREASES BY THE MONTH
Using the data from the CDC,
CASE INCREASES BY THE MONTH
Using the data from the CDC,
To over-simplify:
Date Number of Cases Rate of Increase
January 22 1 case. times 1
Feb. 1 — 8 cases 8 times more than January 22
March 1 — 30 cases 4 times more than February 1
April 1 — 213,144 cases 7,105 times more than March 1 -- or 710,400%
-- 213,114 added
May 1 — 1,062,446 cases 5 times more than April 1 -- 849,000 added
400% increase is also 5 times
June 1 — 1,787,680 cases 77% more than May 1 -- 725,234 added
July 1 --- 2,637,840 cases 48% more than June 1 -- 850,160 added
August 1 -- 4,601,526 cases 74% more than July 1 -- 1,963,686 added Sept 1 -
_________________________________
CASE INCREASES BY THE WEEK
From week to week cases increase as a multiple of the previous Sunday's total.
Beginning on March 1, the base week with only 30 confirmed cases ———
0- March 1 Sunday 30 — base
1- March 8 422 — 14.07 times the previous week
2- March 15 3,471 --- 8.23 times the previous week -- 3,049 more
3- March 22 33,404 --- 9.62 times the previous week -- 29,933 more
4- March 29 104,904 --- 3.14 times the previous week -- 71,500 more
5- April 5 330,891 — 3.15 times the previous week --225,987 more
6- April 12, Easter 554,849 — 1.68 times the previous week --223,958 more
7- April 19 746,625 — 1.35 times the previous week --191,776 more
8- April 26 962,491--- 1.29 times the previous week --215,866 more
9 May 3 Sunday 1,122,486 -- 1.17 times the previous week --159,995 more
10 May 10 1,300,696 --- 1.16 times the previous week --178,210 more
11 May 17 1,467,065 --- 1.13 times the previous week --166,369 more
12 May 24 1,622,114 --- 1.11 times the previous week --155,152 more
13 May 31 1,761,503 1.09 times the previous week --139,389 more
New cases are declining by about 15,300 per week since April 26.
Perhaps by August 2 or 9 the new cases will be zero.
14 June 7 1,920,904 --- 1.09 times the previous week -- 159,401 more
15 June 14 2,063,812 --- 1.07 times the week before -- 142,908 more -- Progress!
16 June 21 2,248,029 --- 1.09 Bad News, reversal -- 184,217 -- back to April 26
We have lost two months of progress !
17 June 28 2,504,175 --- 1.11 times the week before -- 256,146 more than 6/21
Biggest weekly gain ever !
18 July 5 ---------- 2,886,273 --- 1.15 times the week before --- 382,000 more than 6/28
19 July 12 3,296,599 --- 1.14 times the week before --- 410,326 more than 7/5
Almost TRIPLE (2.9 times) the increase of May 31, 6 weeks ago. May 31 week added 139,389 new cases.
Week 20 --- July 19 3,698,161 --- 1.12 times the week before --- 464,800 more than 7/12
20 July 26 ---------4,225,687 -- 1.14 times week before --- 464,324 more than 7/19
21 August 2 --------4,649,102 -- 1.10 times week before --- 423,416 more than 7/26
22 August 9 --------- 5,000,000 - 1.5% of U.S. population, implying 20 million or 6.0% total infected including mild and asymptomatic Covid-19 cases
The New York Times has an excellent graph page showing new cases and total case history for all 50 states and some U.S. property such as Guam and Puerto Rico. And Links Medicus also shows a list of articles to chose from.
Each week the percentage of new cases is lower.
By about May 15 we will stall, no more new cases.
_________________________________
March 31 to April 6, cases double, from 186,101 to 374,329.
If cases double every week, in 11 weeks, by July 17, all 330 million Americans are infected,
assuming cases double every week. Is that "no big deal"? Out of every 100, 20 cases are serious, and 5% of the 20 die, that would be 1 death per 100 Americans die by June 17, total Covid-19 death count 3.3 million . This doubles the annual death count from all causes. Not possible?
Normal death count in 2018 was 2.8 million. This is not an emergency?
The annual death count could double this year. My first paragraph above is less shocking.
The rate of increase is slowing after social distancing is imposed.
Between March 17 and April 1 —14 days — cases increase by a factor of 30
(from 7,023 to 213,144).
Between April 1 and April 15 — 14 days — cases increase by a factor of 3.
(from 231,144 to 632,548)
Between April 15 and April 29 -- 14 days -- cases increase by 55%, a factor of 1.55.
Between April 15 and April 29 -- 14 days -- cases increase by 55%, a factor of 1.55.
From April 1 to April 19 daily increase of cases averages around 29,000 per day, plateauing.
There is a great back-lash against shutting down the economy, naturally. But let’s say every week the case load increases by a factor of 8 or 9, how many beds are there in the hospitals, how many respirators, and how many will die? My guess is between 1mn and 6.6 million unnecessary deaths would occur. Remember 2.8 million was the death count for normal 2018. It looks like 20% of cases, at a minimum, are serious, severe, or critical. It is really unknown how many will die. In Europe they have the best medical care systems in the world and their death rate, CFR, is the highest, over 10% in several countries, twice the US current rate. The US CFR is probably lower because people avoid seeing a doctor because fees and rates are outrageous and wages are horribly low for at least 40% if not 90% of workers.
So instead of protesting low wages citizens protest the lockdown order. I have shown elsewhere on this blog that the combined total wages of the lower half of all workers is less than 8% of the national income. Why not protest that? Why not work for a universal single payer healthcare system or one that resembles the Netherlands, or Germany with strict price controls and insurance regulation?
____________________________________________________________
California declares “shelter in place” on March 19.
From March 17 to April 19, during 33 days, cases increase by a factor of 103, from 7,023 cases to 722,761 cases (the 722,761 figure comes from John Hopkins on April 19).
Between March 17 and April 1 cases increase 30 fold.
From April 1 to May 1 case increases average around 29,000 per day, plateauing.
From April 1 to May 1 case increases average around 29,000 per day, plateauing.
Case increases began at 10,270 a day on 3/24 and doubled within 6 days.
Case increases leveled out after April 1.
The daily increase rose to around 32,000 for eight days, 4/3 to 4/11. This is the spike in deaths week shown in the CDC graph above; 24.8% of all US deaths from Covid-19.
The daily increase rose to around 32,000 for eight days, 4/3 to 4/11. This is the spike in deaths week shown in the CDC graph above; 24.8% of all US deaths from Covid-19.
Then it dropped down around 27,000 to 29,000.
In Three Months, from One to 809,000
First case -- Jan. 22
15 cases -- Feb. 22 increases 15 times from month earlier
33,404 cases -- March 22 increases 2,227 times from month earlier
809,000 (guessing) cases April 22 increases 24 times from month earlier
If new cases continue to increase at 30,000 a day, then by May 22 another 900,000 cases, total of 1.7 million which is 0.5% of U.S. population. With a Case Fatality Rate of 5.0% then 85,000 death count.
If we wrongly lift social distancing tomorrow, then probably by end of June all 330 million Americans would be infected, and the CFR is still unknown. In 2018 2.8 million Americans died from all causes.
In the normal year of 2018 some 2.8 million Americans died from all causes, states the record of the National Vital Statistics System. A very influential report from the Imperial College, March 16, 2020, states, " In total, in an unmitigated epidemic, we would predict approximately 510,000 deaths in G.B. and 2.2 million in the U.S., not accounting for the potential negative effects of health systems being overwhelmed on mortality." A death count of 2.2 million would be equal to the 1918 death count from the influenza outbreak, converting the U.S. population of 104 million with 675,000 deaths to a mortality rate of 0.675%, which is equal to 2.2 million in 2020. That would increase the annual deaths by 75%. On April 8 a revised number, 60,000 deaths, appeared from Dr. Fauci, chief spokesperson for the NIAID, National Institute for Allergies and Infectious Diseases, a division of the NIH, National Institute of Health. This would be 35 times less damaging than the 2.2 million "unmitigated" prediction.
The alarm we face is its unpredictability both in the spread of infection and in the fatality rate. The Case Fatality Rate (CFR) was 4.1% on April 14, 2020, and that means that 605,390 cases have been reported, and 24,582 have resulted in death, a rate of 4.06%. (See the CDC report) But not all infections are reported, and some number are asymptomatic cases, so the 605,930 number of cases is low, but how low no one knows. And the total death number also may be somewhat low.
The main point is “no one knows how bad it could be”. If health care resources are exhausted, if testing is not implemented, if hot spots are not suppressed, and so on.
The CFR was 4.1% a week ago, now it is 5.1%. It may rise considerably if the medical system is overburdened. In France the CFR, death rate, has been reported over 14%, in Italy 12.7%, in Spain over 10%, but in Germany 1.8%. In Japan 0.8%, in New Zealand next to zero. (See the WHO Daily Situation reports.)
Another article deals with the question of sustained long-term social distancing. Though it was published in mid-March it is relevant. A quote: That’s why the Imperial College model suggests that after an initial period of strict social distancing, people could start to move about again — until the number of COVID-19 patients in hospital ICUs rises to a certain level, at which point the restrictions would kick back in. It might look like this: We spend April, May, June and July living a no-school, socially distanced existence, until critical cases fall dramatically. Then we get a few weeks’ reprieve before cases climb up to the trigger point and school is canceled again. The article posits a possible 2.2 million deaths in the U.S.
References, for those who want to read more:
A report from Lancet Journal said that 13.8% “developed severe disease”.
“According to the report from the WHO–China Joint Mission on COVID-19, 80% of the 55 924 patients with laboratory-confirmed COVID-19 in China to Feb 20, 2020, had mild-to-moderate disease, including both non-pneumonia and pneumonia cases, while 13·8% developed severe disease and 6·1% developed to a critical stage requiring intensive care.8” —- from The Lancet Journal, March 30, 2020. “Estimates of case fatality ratio from international cases stratified by age were consistent with those from China (parametric estimate 1·4% [0·4–3·5] in those aged <60 years [n=360] and 4·5% [1·8–11·1] in those aged ≥60 years [n=151]).”
How many people were asymptomatic, or so mild they did not report being sick? Unknown. Is 96% asymptomatic reasonable, as prison studies show?
The take-away fact: about 20% of confirmed cases developed "severe" or "critical" stages. A fatality rate of 1.4% for those below 60 years-old, and 4.5% for those 60 and above. Therefore, in the U.S. 3.7 million aged below 60 years, and about 2.7 million people over 60 would die, a total of 6.4 million Covid-19 deaths, added to the annual expected death count of 2.8 million, for a total of 9.6 million deaths in one year, about 3% of the U.S. population, one in thirty-three. I am assuming universal infection rate. Very dire. Other studies, other suppression mediations, makes forecasting akin to betting on the horses.
Cross-Country Comparison of Case Fatality Rates
'Terrifying' New Research Warns 2.2 Million Could Die From Coronavirus in US Without Drastic Action
A Cross-Country Comparison of National Health Systems from the Commonwealth Fund:
https://www.commonwealthfund.org/sites/default/files/documents/___media_files_publications_fund_report_2012_nov_1645_squires_intl_profiles_hlt_care_systems_2012.pdfApril 7, 2020
Comparing Countries during the Covid-19 Outbreak
Comparing total deaths among 13 selected countries on April 9, 2020, and lastly with the influenza epidemic of 1918 in the U.S.
To understand how deadly the Covid-19 is one has to know how easily it is transmitted, and how many of the infected die. Once infected the treatment may bring down the death rate, but maybe not.
Some countries prevented the transmission, and some countries had a low death rate among those who contracted the Covid-19. I took the low transmission winners, then took a look at their death rates, and arrived at a total mortality rate. The winner is New Zealand and next is Japan. But I only selected 13 countries to compare.
With Covid-19 the name of the game is keeping total deaths as low as possible. Total deaths is a combination of the transmission rate of the disease (the portion of a nation that is infected) with the death rate of those infected. For instance, say out of 100 population 5% are infected, and 2 die. Then infection rate is 5%, the death rate is 40% and the mortality rate is 2%. I call the deaths among the infected the “death rate”. I call the death among the total population the “mortality rate”. The two rates are not the same. For reasons not clear in some countries death rate from the illness is higher, such as in France where it is 14.3%. But in Spain the final mortality rate is higher because a greater portion were infected. I used the data from the “Situation Report” from the WHO, April 9, 2020. (see here —https://www.who.int/docs/default-source/coronaviruse/situation-reports/20200410-sitrep-81-covid-19.pdf?sfvrsn=ca96eb84_2)
And to put it into another perspective I tried to compare my numbers with the 1918 Influenza outbreak in the U.S.
So, to begin: Japan restrained the transmission of the disease in its population, 4 out of 100,000 were infected (data from the WHO situation report). But New Zealand has a lower death rate, therefore its mortality rate was lower, it is the winner, so far.
Country — Infection Rate —- Death Rate —- Mortality Rate
New Zealand 0.02% 0.1% 0.000002
Japan 0.004% 0.8% 0.000032%
Australia 0.02% 0.8% 0.00016
Canada 0.05% 2.3% 0.00115%
Norway 0.11% 1.4% 0.0015%
Austria 0.14% 2.0% 0.0028%
Germany 0.14% 2.1% 0.0029%
Iran 0.07% 6.2% 0.00434%
U.S.A. 0.13% 3.4% 0.0044%
United Kingdom 0.09% 12.2% 0.011%
France 0.13% 14.3% 0.0186%
Italy 0.24% 12.7% 0.0305%
Spain 0.32% 10.0% 0.0320%
Spain with a population of 47 million has had 15,238 deaths from Covid-19, that is a mortality rate of 0.032% or 3 out of every 10,000. In the U.S.A. in 1918 during the influenza outbreak the mortality rate was 65 for every 10,000.
The 1918 episode in the U.S. was 20 times worse than what has happened recently in Spain. If we replicate, and we won't, the 1918 episode, the U.S. will have 2.2 million deaths. The CDC states, "In 2018, a total of 2,839,205 resident deaths were registered in the United States". A repeat of the 1918 flu would change the 2.8 million to 5.0 million deaths, an increase of 79% -- not quite doubling. Recent prognosis was between 100,000 to 200,000 Covid-19 deaths, but now the expert expectation is for 60,000 Covid-19 deaths. That's a 2.1% increase in projected number of U.S. deaths for 2020. If so, then 1918 would be 40 times worse than 2020. The economic price though may be greater.
U.S.A in 1918 —-
unknown unknown 0.65%
The influenza outbreak in 1918 to 1920 was brutal, there were 675,000 deaths in a total population of 104 million, and that equals a 0.65% mortality rate in entire population (65 in every 10,000). Spain with the worst track record so far has 3 deaths per 10,000. The CDC article, referenced below, states that a third of the world's population were infected. The same "mortality rate" of 0.65% today would result in 2,100,000 U.S. deaths, 35 times worse than the recent prediction of 60,000.
For information about the U.S. 1918 influenza I took the data here:
https://www.cidrap.umn.edu/news-perspective/2020/04/great-influenza-author-talks-covid-19-1918-flu and the CDC article here.
The interviewee made these observations:
“You know, it's not clear how many people died from ARDS [acute respiratory distress syndrome] in 1918 or bacterial pneumonia. Some say the vast, overwhelming majority of deaths in 1918 were due to bacterial pneumonia, but I don't share that view. There were very rapid deaths in a few days from symptom onset. That clearly wasn’t bacterial. . . .
Influenza in 1918 to 1920 would burn through a community in 6 to 10 weeks, and then you forget about it. That's not going to be the case with this. Whether COVID-19 results in a flatter, more continuous line or undulates is not clear. . . .
Metropolitan Life concluded that more than 3% of all industrial workers died because of the flu, and remember how compressed the time frame was—6 to 10 weeks to pass through any community. So when 3.25% of entire population in a working age-group die in a matter of a few weeks, that's a pretty good reason not to go to work.”
I have to credit Joe Bender for putting me onto this investigation. He made a sour comment about how countries with universal health care were doing worse than the U.S. Well, that is clearly nonsense, take a look at Canada, but it is a start for comparing what happened, and asking why. In the U.S. there was an 18 day period when the infected number jumped by 30 times, from 10,000 to 300,000. I wonder if it would keep jumping at that rate without social distancing, and if not, why not. By the end of May about 80% of the U.S. population would be infected, and the death rate could, plausibly, be at 2 million. Hmmm? I’m still not convinced that herd immunity would lower than number. The big question now is what would happen if we reversed the “shelter-in-place” order, went back to business as normal, let herd immunity take its natural course. For people over 64 years-old that would not be a great adventure. The rest of society might do OK, but I think in the U.S. those over 64 make up 78% of deaths. We’ve got 49 million over 64. We might lose a million out of 49 million. Is it worth the sacrifice? Not to me, I might be one of them. Send me to a concentration camp, a detention camp in Hawaii maybe.
Hope this made some sense. I want your response. Thanks. Ben.