This comes out of the American Prospect magazine, and it's a great article. B.L. 2.27.19
Thursday, February 14, 2019
My first essay at this #2 spot. http://benL88.blogspot.com See my original blog: http://benL8.blogspot.com
(Below this first essay is another on Climate Change)
Poverty, Hardship, “Doing OK”, and “Living Comfortably” in the U.S.A.
The disruptive effects of inequality are not clearly perceived by the American public. If they were the political conversation would seek to repair the decades of tilted growth, and to shore up the majority of households who simply are not making it adequately.
The Consumer Financial Protection Bureau, a creation of now Senator Elizabeth Warren, published a survey “Financial Well-Being in America” in 2017, and certain details exemplify the sad, precarious and inescapable conditions confronting too many Americans. The questions about “liquid assets” show that 24% of adults have less than $250 in savings or liquid assets, 35% have less than $1,000, 54% have less than $5,000, and 73% have less than $20,000 (Exhibit A5). In stark contrast the Federal Reserve report, Flow of Funds (page 2), shows the total net worth of U.S. households stands at $109 trillion, and that comes to a “mean average” savings of $858,267 per household. Half of households own less than $82,000 including non-liquid assets, that is including the value of their homes, as reported by Edward N. Wolff in December, 2017. And in the same report, 40% are reported to owe approximately 0.5% of total wealth, that is, their debts are greater than their savings. Nothing could more clearly demonstrate the immoderate nature of the nation’s inequality.
The same CFPB report says that 43% of Americans “have difficulties making ends meet”, while 34% report they “experience material hardship”. The Federal Reserve report on Household Well-Being says that about 40% of adults have “scores that suggest a high likelihood of material hardship". And while the official U.S. Census reports that 12.3% live in poverty, and theSupplemental Poverty Measure (SPM) shows 13.9%, many scholars maintain that this understates poverty by half. In 2013 one of the authors of the SPM wrote (page 23) that 29.9% of Americans were unable to “achieve a safe and decent standard of living”. A report from the United Way charity, the ALICE report, surveying all the counties in the U.S. and focusing on 15 states, claims that 40% of households cannot afford the cost of seven normal expenses: food, shelter, utilities, medical care, transportation, phone service and child care.
Moving up above the lower 43% who are poor or struggling, there are 25% in the middle who state they are “doing OK”. This mediocre condition is short of the experience of the highest earning 33% of American adults who report they are “living comfortably”. These are the findings of the CFPB report.
Expanding this picture shows that at the bottom, at least 1% live in extreme poverty, living on less than $2 a day income; a total of 5% live in “deep poverty” or below half the official poverty level; then a total of 13% or so live below the official poverty level (including the extreme and the deep groups); and a total of about 25% (estimated) live in the condition of “unable to achieve a safe and decent standard of living”, and then 34% experience hardship (inability to pay normal expenses), and 43% worry about making ends meet. Coincidentally, the SPM shows that 43% of Americans live with incomes below 200% of the Federal Poverty Level; their incomes are measured after paying all taxes and receiving all government benefit transfers. That completes the lower earning 43%. Next there is a core of 25% who are “doing OK”, and then at the top end, those 33% who are “living comfortably.”
The national mean average household income is around $120,000 per year, but half of all households live with incomes below $61,372. (In 2018 the Joint Committee on Taxation reported a national income of $15.0 trillion, and the Census reports 127 million households, and this reflects an average income of $118,165 per household.) Furthermore, the mean average household net worth is $858,000 per household, yet half live with less than $82,000, and the lower 40% have negative net worth. Another measure from the Bureau of Economic Analysis shows that $47,421 is the post-tax income for each citizen in the nation, all 325 million citizens; and that equates to an average post-tax income of $189,684 for all 4 person households. Yet half of all four person families have incomes half that amount, or $94,876 in pre-tax income. Their post-tax income is below $70,000. These high levels of poverty (13%), hardship (34%) and worrying about not “making ends meet” (43%), and even the weak admission of just “doing OK” (25%) are surprising and unacceptable in a nation where all could be at the level of “living comfortably”. And the paucity of savings among the lower-earning 80% is clearly a rebuff to those who believe the economy distributes its resources fairly.
A report from the Economic Policy Institute, “The New Gilded Age”, shows (page 12) with voluminous detail the history and extent of income inequality. In short it contrasts two periods of growth, the 28 years between 1945 and 1973, contrasted with the 42 years 1973 to 2015. In the first period 4.9% of growth went to the top-earning 1%, and 95.1% went to the lower-earning 99%. In the second period 56% went to the top 1% while 44% went to the lower 99%. In the first period the real inflation adjusted incomes of the 99% doubled, all 99% of households increased income by 100.1% in 28 years. In the second period of 42 years the lower 99% increased their incomes by 15.4%. The top 1% increased their incomes by 216.4%, more than tripling. This is a jaw-dropping report of extreme economic disruption.
Personally I think the remedy for this is to create tax incentives for corporations to increase the wage incomes of their employees. Extensive research shows that corporations are distributing over 90% of their profits into stock buybacks or shareholder dividends. The big money in the economy is found in the biggest corporations, and they can easily afford increasing workers’ salaries. Over half (53%) of U.S. workers work in firms with more than 500 employees, which pay 59% of all wage income. The Bureau of Labor Statistics, BLS, shows that the “average weekly earnings of production and nonsupervisory workers”, 80% of all workers, was higher in 1964 than today in 2019, incredibly. The BEA.gov (Table 2.1) shows that post-tax income has tripled for all citizens on an inflation adjusted scale. The per capita economy triples while 80% are earning virtually the same as they earned 54 years ago! Corporations can afford to do better by their workers.
The other remedy is raising the minimum wage to somewhere near $15 an hour. This may prove impractical as lower paying employers operate small firms that may find it difficult to increase their overhead. But an increase for these lower paid workers is necessary. The ALICE report shows that 40% of workers earn below $15 an hour, and 60% earn below $20 an hour. The U.S. Census states that the median male full-time worker earns about $25 an hour, and the female full-time worker earns $20 an hour, at the median. But -- and it's most meaningful -- the Social Security Administration report on wage income shows that the lower-earning half of all U.S. workers have a combined income of less than 8% of the total U.S. income (see the Joint Committee on Taxation report, page 31, for the table on total income and taxes).
While this article is dense with numbers, the simple fact that stands out is that too many are struggling in an economy that is never-before so affluent. _________________________________________ Additional Reading and Listening Marjorie Kelly's book Owning Our Future - The Emerging Ownership Revolution, Journeys to a Generative Economy, 2012, focuses on converting corporations from extractors of resources to generators of prosperity. What changes in corporate structure and purpose are needed? She works for theDemocracy Collaborative .org. She's written extensively, see her bibliography. A quote from page 20, the corporation's "purpose is manufacturing financial wealth in endlessly growing quantity. . . this extraction weakens the vitality of the real economy of jobs, families, and communities." (A new book is announced, June 1, 2019, "The Making of a Democratic Economy". David Korten wrote his response: "As champions of worker and community ownership, Kelly and Howard remind us that economic democracy is essential to political democracy and a viable human future."
—David Korten, author When Corporations Rule the World and Change the Story, Change the Future: A Living Economy for a Living Earth.
I also like this comment: "Marjorie Kelly and Ted Howard have given us the roadmap toward economic democracy. But they don’t just show the interstates and the major landmarks— they show the byways and small towns where real change comes from. In this moment when greater and greater numbers of people are realizing that the rules of capitalism must be rewritten, the stories in these pages, and the strategies that Kelly and Howard share, will guide our way forward. — Lenore Palladino, Senior Economist, The Roosevelt Institute
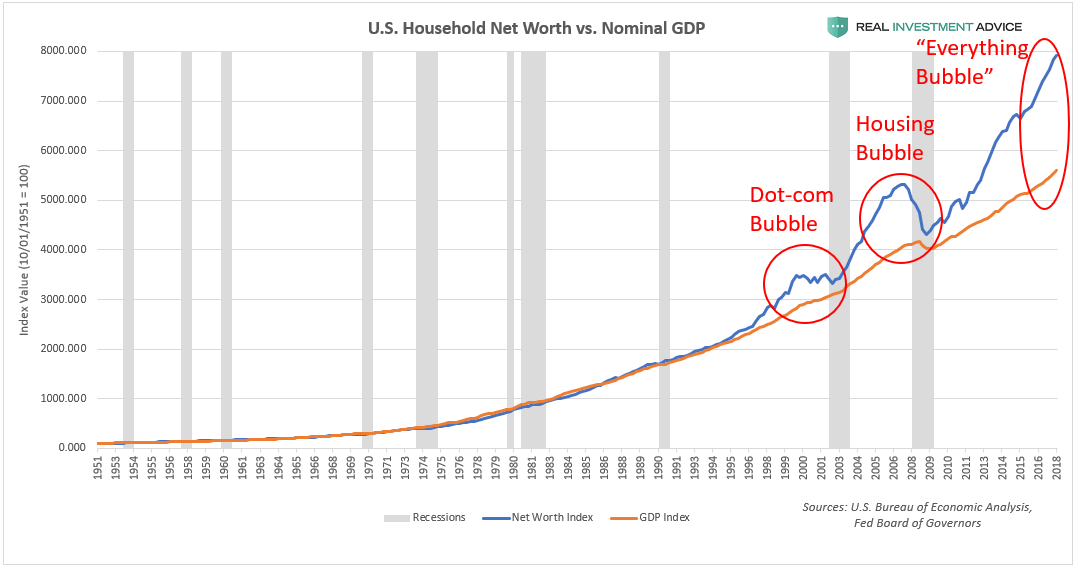
As I said somewhere William Lazonick states that 1,910 corporations generate 44% of all receipts, employ 34% of all employees, and have an average employee size of 25,000. Those are the trouble-makers, and that benevolent veneer is just that, only skin deep. Now for listening: Pitchfork Economics, podcasts see here. Nick Hanauer co-publishes this web page. He has the distinction of arguing for much higher tax rates on the wealthiest in his article at the American Prospect. In their first interview they invite William Lazonick to explain the essence of stock buybacks. From Hanauer's recent, Summer 2018, article, about lowering taxes on the rich and corporations: "As a venture capitalist and serial entrepreneur who’s made a personal fortune founding or funding more than 30 companies, I can tell you firsthand that this classic trickle-down narrative represents more than just a fundamental misunderstanding of how market capitalism works; it is in fact a con job and a threat—an intimidation tactic posing as a theory of growth." ________________________________________ GDP to Wealth graph from Real Investment Advice, a financial advisory firm. Other sites also have iterations of this graph, if one wishes to hunt. I've published it before at EWG, part one.
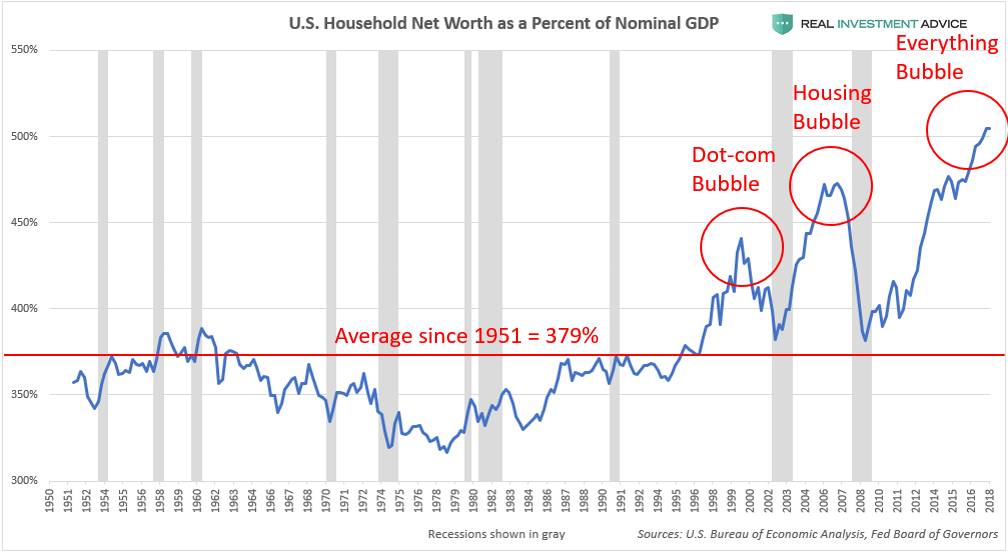
And more important is this second graph,
From 1952 to 1997 it averaged about 350% of GDP, now it's floating above 500%. So it is about 42% too high above the 45 year average. Now, late February, 2019, the S&P 500 is at 2,792, and should it be 1,619? That's my rough estimate of where it should be.
In October, 1972, "average weekly earnings of production and nonsupervisory workers" was at a high, about 8% higher than in January, 2019. (Another graph of this, unadjusted for inflation, is available at the FRED series of graphs, Federal Reserve) Weekly and yearly earnings dropped 5% over the 70s, and then another 15% until 1993. The graph above shows the lowest ratio years, net worth to GDP, were from 1974 to 1979. This is why I advocate a large tax on wealth, stronger union powers including strike rules.
James Cypher, in an article published at Dollars and Sense magazine, July, 2011, "The Purloined Trillions" writes, "In 2009, stock owners, bankers, brokers, hedge-fund wizards, highly paid corporate executives, corporations, and mid-ranking managers pocketed—as either income, benefits, or perks such as corporate jets—an estimated $1.91 trillion that 40 years ago would have collectively gone to non-supervisory and production workers in the form of higher wages and benefits. These are the 88 million workers in the private sector who are closely tied to production processes and/or are not responsible for the supervision, planning, or direction of other workers."
Take the $1.9 trillion and divide it among the 88 million workers --- a raise of $21,704 per worker.
Few Americans are informed, and I think most economists are remiss in dismissing this important fact.
In 2018 only 25,000 workers conducted "work stoppages", or went on strike, in actions involving over 1,000 workers. In 1974 the ratio of striking workers to total workers much higher, and if -- that elusive if -- (and if) the same ratio had been striking in 2018 then some 3.3 million workers instead of 25,000 would have been striking. Strikes have nearly disappeared, as wages have stagnated.
Income and wealth should be transferred back to levels of the 1960s and 70s. That sounds like confiscation, but it is striking a healthy balance (pun unintended). The gains of the elite 1%, the tripling of their incomes, were not earned -- policy made it possible -- their gains were stolen in effect by changes in policy. Capitalism has inherent defects, it is not pie-in-the-sky-wonderful. See the great blue graph by Giovannoni in my essay here.
To learn more about the above graphics
Using the same graphs above, Jesse Colombo publishing at Forbes magazine argues that, "The current U.S. household wealth bubble will end the way that the last several asset and wealth bubbles did: from the ending of the loose monetary conditions that caused it in the first place. As hedge fund manager Jeff Gundlach put it, the Fed will keep hiking interest rates until “something breaks.”
Colombo's article is a thorough examination of the interplay of inflated wealth levels, interest rates, debt burden, CPI to rent to housing costs. It shows that housing costs in late 2018 are almost at the same emergency level above the rising CPI level they were in 2007. Corporate debt levels also are at a high, foreboding a collapse that would create unemployment and recession. Debt levels triggered the collapse of 2007.
I checked the Fed's Flow of Funds, December, 2018, Table D.3, about debt levels. Since 2008 the "Domestic Financial Sector" "Outstanding Debt" has decreased by a third, from 122% of GDP to 79%. That's good. But still too high. Government debt (federal and state and local) has risen by 100%, not good. Corporate debt is about the same level 75% when in 2008 it was 73% of GDP. Household debt has dropped from 96% to 76%. And the total of all debt has increased from 239% of GDP to 250% in 2018. The question I find unsolvable is how housing and rent can be so high. The wealth effect has some influence, the low interest rates on mortgages another. The gap between CPI growth and housing price growth is now the same as in 2008. Not good. In two days the Flow of Funds will be published, March 7, 2019.
Instead of Enriching Shareholders, These Companies Could Give 8 Million Workers a $46,000 Raise
This article appeared in the magazine In These Times, by Colleen Boyle, February 4, 2019. It documents the profit dispersal of the 30 companies comprising the Dow Jones Index, the total dollars dispatched to stock buybacks and dividends. If instead they had given bonuses to all workers? For some corporations it would be a raise of $165,000, for others just $4,000; the average $46,000. There is a table at the bottom showing the median wage income of each company's workforce, and the hypothetical bonus. This paragraph, written by Colleen Boyle, not me, asks the most important question:
It’s difficult to quantify the economy-wide impact of this shift in wealth. In 2017, the U.S. median household income was $61,372. Median income for men was $44,408 and median income for women was $31,610. Imagine if several million workers had an extra $10,000 a year to spend on their families. Or $20,000. Or $100,000. Much of that money would circulate in local economies rather than sitting in a small number of investment accounts.
If the largest 1,909 U.S. corporations employing 34% of all workers and generating 44% of all revenue that William Lazonick writes about dispersed most, say 60% to 75%, of their profits to workers (IF? remember) instead of shareholders, then how much would all workers benefit? And beyond the largest firms, there is a domino effect, and lower-wage workers in smaller companies would gain. The ALICE reports from United Way shows that around 50% of workers worked in firms with more than 500 workers. As I show in my last essay at blog 1, see here, the lower-earning 90% has lost since 1980 about 18% of the income share, a drop from 55% to 38%, and that averages close to $20,000 per worker.
At risk is the overall health of the economy and of the society, I maintain.
_____________________________________________________________________
The Mariposa Gazette published the following essay on Climate Change on April 4, 2019.
1 of 8
McClintock Wrong about Climate Change
Two weeks ago the Gazette carried a column by Congressman McClintock who argued that climate change is not a problem, not a “purported apocalypse.” In contrast to his view the Fourth National Climate Assessment report to Congress of 2017 states in its executive summary, “The global atmospheric carbon dioxide (CO2) concentration has now passed 400 parts per million (ppm), a level that last occurred about 3 million years ago, when both global average temperature and sea level were significantly higher than today. Continued growth in CO2 emissions over this century and beyond would lead to an atmospheric concentration not experienced in tens to hundreds of millions of years. There is broad consensus that the further and the faster the Earth system is pushed towards warming, the greater the risk of unanticipated changes and impacts, some of which are potentially large and irreversible.”
Atmospheric change is a slow process by human standards. Certain studies predict that the great Himalayan mountain range will be denuded of glaciers by 2100, and the great rivers of that area will create potable and irrigation water shortages, and groundwater aquifers will run dry, and up to 2 billion humans will suffer food shortages. This qualifies as apocalypse. The glacier on Mt. Lyell, ten miles south of Tuolumne Meadows, is now nearly gone due to global warming. And in Mariposa, and the San Joaquin Valley, wells are not recharging as they have before. We’ve had more drought years over the past ten years than non-drought years. The Colorado River Basin has been in drought for 16 years, and Lake Mead and Lake Powell are carrying 40% of their capacity, the lowest level since 1937 when they were filling up. The nine warmest years on record occurred in the past eleven years. And extreme weather events — ranging from polar vortexes to hurricanes, ocean surges, floods, and wildfires — have served to shift public opinion about climate change. Reuters and Gallop polls in the past year record a majority of American adults now believe that human activity is changing the climate and it poses a threat, either serious, imminent or dangerous, to our life style.
The Union of Concerned Scientists states, “The scientific consensus is clear. Building on two previous studies, a landmark 2013 peer-reviewed study evaluated 10,306 scientists to confirm that over 97 percent climate scientists agree, and over 97 percent of scientific articles find that global warming is real and largely caused by humans. . . . This level of consensus is equivalent to the level of agreement among scientists that smoking causes cancer – a statement that very few people, if any, contest today.” The debate will never be over, but in practical terms, it’s over, and no one’s views are being suppressed.
Last August the CBS News reported, “‘We have 129 million dead trees from drought and bark beetle infestation,’ said Information Officer Scott McLean of CAL FIRE, the state's lead department fighting these explosive blazes, which last year alone cost California 43 lost lives and $13.2 billion in damages. And this year could be even harsher. ‘September and October are historically our worst months,’ McLean warned.
‘You can get in a plane and fly for literally hours over dead forest,’ said Entomologist Diana Six of the University of Montana, who studies the bark beetle. ‘This is massive. Beetle outbreaks have been happening for thousands of years. But this one is estimated to be more than 10 times bigger.’
Climate change also plays a major role: The biggest boost to the bark beetle population has been the change in temperature worldwide. While the planet has warmed ‘only’ 1.5 degrees since 1880, the main enemy of the insect's eggs has been a hard freeze. The temperature on the coldest winter night is now six to seven degrees warmer in many areas of the country than it was 50 years ago, according to a Dartmouth College study.”
Republican Senator Lamar Alexander recently proposed doubling budget of the Office of Science at the Department of Energy, from $6 billion to $12 billion. But the Trump/GOP proposal is to cut $1 billion from the budget. The research would explore renewable energy alternatives, and it is supported by many Democrats. Transitioning from a fossil fuel energy system to a renewable electric system is a massive but necessary undertaking and opportunity. Jon Rynn’s book Manufacturing Green Prosperity is a road map. It is less expensive to move into a renewable future than perish in smoke, fire, and an inundated landscape.
Today, August 6, 2025, I'm writing here, the November 2020 site, about lesser important news. At the top of my blog page are my BIG IDEAS essays, the most important statements. Those title articles are more important than the notes I'm adding here. I'll place the lesser important essays here chronologically, the most recent on top, the first on the bottom.
Today: August 6, 2025
Slashing More than a Fifth of Non-Military Spending
What's going on with Trump/GOP's cuts to government services and agency practices?
I was reading an article, "They Shoot Messengers, Don't They? What Trump and Erdogon Share" at the Center for Economic Policy Research. Answer: They both fire department heads who report bad news. The article concerns the firing of the head of the Bureau of Labor Statistics recently. In the middle I came across a list of budget cuts and acts of sabotage against government agencies. I began to research cuts to government services as a result.
A little background first, and then the CEPR article:
In a nutshell, the One Big Beautiful Boondoggle Act (see the link to an article from the Tax Foundation) will cut federal tax revenues by $5 trillion (over 10 years). It's like digging a hole 5 feet deep. But economic growth will fill-in 1 foot, and cuts to government programs will fill in another 1 foot, leaving the hole 3 feet deep. But, the interest payments needed will deepen the hole again by another foot. The hole will be 4 feet deep in 10 years. This article from the Tax Foundation explains the cuts. These $5 trillion in cuts will be balanced by about $1 trillion in economic growth and $1 trillion in cuts to programs like Medicaid, SNAP, climate mitigation, and renewable energy support. But increased interest payments on borrowing will cost the government another $1 trillion -- resulting in a net national debt increase of $4 trillion over 10 years. (from the Tax Foundation article, hyperlinked above)
Big numbers, but let's put them into perspective. Adding $4 trillion more debt in 10 years is nothing. The total private household net worth today is $170 trillion. The national public debt in December 2024 was $28.9 trillion. Another $4 trillion brings it to about $33 trillion. Private wealth has grown by 132% (a multiple of 2.3 times) since March 2009, 16 years. It was $48.475 trillion in March 2009, and now it is $170 trillion, and adjusting for inflation it has increased by a multiple of 2.3 (from $73 trillion to $170 trillion). Wealth in "real" inflation adjusted terms grew by almost $100 trillion in 16 years, which is a growth of $6.06 trillion each year, or $60 trillion in 10 years (inflation adjusted). It appears that our economy is structured to increase wealth, and to increase poverty.
The public debt ($28.9 trillion) is one sixth (17%) of national privately held wealth ($170 trillion). If I had just $100 in my wallet, and also a normal expense of $17, I would not go out and get a loan to pay it. I'd take out my wallet and pay it. That's what we should do --- tax wealth. Or at least raise the income, capital gains and financial transaction tax on the multi-millionaires. Actually we should tax everything exasperates the enormous wealth disparities we experience. Sorry if that offends you. But to continue ------
Which agencies will see reduced budgets? All agencies except Homeland Security, Transportation Dept., and the Veterans Administration. Department of Defence and War receives an increase, but is not included in the graph below.
I found the graph confusing, but follow the red line, it shows the percentage of budget cuts to various agencies, the right side scale; at the far right the NSF and EPA and SBA receive massive cuts. The averag cut for all is 22%. HUD, State Dept., Dept. of Labor, Dept of Interior that administers Food Stamps (SNAP) are cut by 35%. Social Security appears to receive no cut.
The second largest federal department is HHS, health and human services; it receives a 25% cut. Think Medicaid and Medicare.
"President Trump on Friday [April 25, 2025] unveiled an initial version of his $1.7 trillion fiscal 2026 discretionary funding budget, which included staggering cuts of 22% to non-defense agencies. (These are budgetary "discretionary" departments, not the "nondiscretionary programs such as Social Security, Medicaid, Medicare.)
The Defense Department would see its funding increased by 13% to more than $1 trillion, more than 10% of which would come in the proposed reconciliation bill. Nearly every other agency in government would see dramatic reductions.
--------------------- Now for the article from CEPR, "They Shoot Messengers, Don't They" -----
From this article at the CEPR I found a paragraph about spending reductions or eliminated practices:
Example One: Human Rights, "The State Department under Marco Rubio seems to think little of human rights and seeks to change the term’s definition. NPR reports that the department will no longer include criticisms of poor [foreign] prison conditions, [foreign] government corruption, or political processes that are restrictive, in its reports on international human rights. That means [foreign] government repression, such as restricting peaceful assembly or preventing free and fair elections, will no longer be documented by the agency." (from this CEPR.org report)
Example Two: Data on Greenhouse Gases: "The Environmental Protection Agency is planning to eliminate long-standing requirements for polluters to collect and report their emissions of the heat-trapping gases that cause climate change. The move, ordered by a Trump appointee, would affect thousands of industrial facilities across the country, including oil refineries, power plants and coal mines as well as those that make petrochemicals, cement, glass, iron and steel, according to documents reviewed by ProPublica."
Example Three: U.S. Census reduces staff, "As federal agencies brace for the Trump administration's next round of slashing the U.S. government, recent staff departures are already raising concerns about whether the Census Bureau can continue producing reliable statistics for the country."
Example Four: Censuring Academic Journals: "The Trump administration has slashed funding for universities and scientific research. Now, its lackeys appear to be escalating their tactics by menacing academic journals. . . . "A publication's editorial decisions are none of the government's business, whether it's a newspaper or a medical journal," JT Morris, a senior supervising attorney at the Foundation for Individual Rights and Expression"
Example Five: Disappearing Government Agencies' web pages: "On Friday January 31, 2025, several federal government datasets went offline. The datasets taken down included some widely used, large-scale national health surveys, indices, and data dashboards that inform research, policy making, and media coverage about health care and public health. For example, several Centers for Disease Control and Prevention (CDC) surveys and datasets were offline. . . (re a CDC survey now offline) The survey has been used for decades to inform policymakers, the media, and the public on a wide range of health topics, such as obesity rates, access to breast cancer screenings, vaccination rates, and the share of people with pre-existing conditions." (from Kaiser Family Foundation article)
Example Six: Budget Cuts to agencies: Headstart, Environmental Protection Agency, IRS. "Looking at his initial or “skinny” budget proposal, along with an “appendix” the White House released last Friday, Trump’s budget would eliminate at least 46 programs and agencies." (from a PBS article, https://www.pbs.org/newshour/politics/46-programs-trump-wants-to-eliminate-according-to-his-proposed-budget)
Example Seven: Elimination of Climate Change mitigation laws: "Summary
Trump proposes $15 billion cuts to renewable energy, carbon capture
Cancels $6 billion for EV chargers
Unclear how Congress would make cuts to funds already in US law
$4.5 billion in USDA cuts includes conservation programs
Plan entirely cuts EPA program on environmental justice
WASHINGTON, May 2 (Reuters) - U.S. President Donald Trump's administration on Friday proposed cutting billions of dollars in federal funding next year for projects including renewable energy and electric vehicle chargers, and gutting programs aimed at curbing climate change.
The proposal to Congress was part of a wider request to cut $163 billion in 2026 federal spending, slashing more than a fifth of non-military spending.
Five years ago, I wrote,
March 24, 2020
The Economic Fallout of the Corona Virus Crisis -- The Nation Is Not Prepared, and What To Do?
Why a Moratorium on Rent and Mortgage Payment Is Needed
American families must now brace for the steepest collapse of GDP since 1958, says Barron’s magazine quoting Goldman Sachs and J P Morgan banks. A quarter of GDP will soon be missing, a drop from $21.4 trillion to $16 trillion is projected. Personal and household incomes will collapse also. This is will be a year to remember.
Americans are not financially prepared for this. In September 2017 the Consumer Financial Protection Bureau published a Financial Well-Being report and asked adults "How much money do you have in savings today (in cash,checking, and savings account balances)?” This is called "Liquid savings."
less than $250 — 24%
less than $1,000 — 35%
less than $5,000 — 54%
less than $20,000 — 73% American adults answered.
Meaning the majority are not prepared for an extended loss of income.
The Prosperity Now web page, Scorecard, found that -- Nationwide 25.4% of credit card holders have reached the 75% of credit limit on their cards;
Those who have saved for emergencies — 57.8% have saved — 42.2% have not saved
Consumers with Debt in Collections — 21.2%
Another poll asked about missing a paycheck, every two weeks, would it be a difficulty? The American Payroll Association reports 74% said yes; 40% said a major difficulty, and 34% said a slight difficulty. A Harris poll found that respondents say they always (23%) or usually (17%) or sometimes (38%) live paycheck to paycheck, for a total of 78%.
Many household budgets cannot fall back on savings to get through a "shelter in place" order. Without savings and without an income, many Americans are between a rock and a stone wall. A HUD.gov site says that 9% of Americans pay more than 50% of income on housing. A Harvard University study shows that 30% of Americans pay over 30% of their income on housing. Another Harvard University study found that 1 in 4 renters pay more than 50% of their income in rent. Workers in “non-essential” jobs no longer have incomes, they are directly affected by the work stoppage, and many rent their living quarters.
The Brookings Institute report “Meet the Low-Wage Workforce” examines the incomes of roughly half of U.S. workers, the low-earning half. It shows that $19,000 a year is the average income for 67% of workers who earn below the median wage income for all workers, $32,838. The other 33% are very low earning workers earning below $7,500 a year. If we take the total income in the economy, about $18.8 trillion, and divide that among the 168 million workers, we arrive at an average of $112,000 per worker.
We have staggering inequality. The U.S. is peculiarly bi-polar in the department of income and wealth. It may surprise many to know, and it surprised this writer, that the average wealth per household is $924,000. On March 12, 2020, the Federal Reserve reported in its Flow of Funds report, page 2, that total household net worth peaked at $118.3 trillion. Divided among the nation’s 128 million households that comes to $924K per household. Unfortunately 40% of households own just 0.1% of all wealth, states the Credit Suisse report on Global Wealth. Average wealth per adult in that group is about $2,000.
The average yearly household income, not wealth, before taxes is over $140,000, states the Bureau of Economic Analysis, Table 2.1. But half of households have incomes below $64,000, and many of them much below $64,000. The per person annual “disposable personal income” after taxes is now $50,504 says the same BEA table. Does it surprise anyone to learn that $24,405 is the median income per person for all four person households? The average is $50,504, but half have less than $24,405 per person, and often much less than $24,405. Those in official poverty live with below $6,500 per person. See the U.S. Census hinc-01 table. The numbers are difficult to digest, but the incongruity is not.
It’s a sad truth, that many Americans are unaware of the great disparities among U.S. households. The household medians, for both wealth and income, are far below the averages which are raised by the very high amounts at the tippy-tippy-top, the 1 percent.
The United Way charity reports in its ALICE report that 40% of Americans live with hardship or experience poverty. In a land where $50,000 of after-tax income per person is a fact, and over $400,000 of savings per adult is a fact, we have 40% who struggle to pay for necessities. It is a strain on the imagination. An income of $61,589 for a four person household, in 2020, is the ALICE Survival Budget income. This is 2.4 times the poverty official level. Meaning that the poverty level is much lower than the stressed out level.
Will low income workers be able to pay for necessities over the next few months is an extremely critical and unanswered question. The nation is watching. We have the resources, the nation is very wealthy, but can and will we protect and support those who have no “spare tire”.
The next few months or year will be an agonizing struggle economically for most households. The objective of planners and of our democratic process should be to insure that most workers and families get through this desperate period, and that future prosperity will be shared instead of our past 40 to 50 years of one-sided advantage.
WHAT TO DO --
The above was a letter to the New York Times, March 24, 2020. Below are 1) an article by Robert Pollin, and 2) a series of proposals from economist Jack Rasmus, and 3) an Op-Ed in the NYTimes written by economist Robert Kuttner.
The Case of the Lost Dog Who Did Not Bark, (that's me, I wrote this Nov. 2018)
I'm disappointed with Google, but it is free. I lost my original blog -- http://benL8.blogspot.com -- Economics Without Greed --- due to some error with passwords, and now I start a new "son of . . ." blog, part two. Try to find the original with it's laborious essays. And read on here. I'll post something soon enough. Nice photo, that is Hosmer Lake in Oregon's Cascade range, near Bend, Oregon. It originally was called Mudd Lake, and then changed to Hosmer, an improvement. Like this new blog!
Today I'm placing some less important news and reporting. My title articles are more important than the notes I'm adding here. I'll place them chronilogically, the most recent on top, the first on the bottom.
Today: August 6, 2025
Slashing More than a Fifth of Non-Military Spending
What's going on with Trump/GOP's cuts to government services and agency practices?
I was reading an article, "They Shoot Messengers, Don't They? What Trump and Erdogon Share" at the Center for Economic Policy Research. Answer: They both fire department heads who report bad news. The article, from the Economic Policy Institute concerns the firing of the head of the Bureau of Labor Statistics recently. In the middle I came across a list of budget cuts and acts of sabotage against government agencies. I began to research cuts to government services as a result.
A little background first:
In a nutshell, the One Big Beautiful Boondoggle Act will cut federal government tax revenues by $5 trillion (over 10 years). This article from the Tax Foundation explains the cuts. This cut will be balanced by about $1 trillion in economic growth and $1 trillion in cuts to programs like Medicaid, SNAP, climate mitigation, and renewable energy support. But increased interest payments on borrowing will cost the government another $1 trillion -- resulting in a net national debt increase of $4 trillion over 10 years. (from the Tax Foundation article, hyperlinked above)
Which agencies will see reduced budgets? All agencies except Homeland Security, the Defense (or War) Department, Transportation Dept., and the Veterans Administration.
I found the graph confusing, but follow the red line, it shows the percentage of budget cuts to various agencies; at the far right the NSF and EPA and SBA receive massive cuts. Even Social Security gets a minor cut of about 5%. The averag cut is 22%. HUD, State, Dept. of Labor, Dept of Interior that administers Food Stamps (SNAP) is cut by 35%. The largest department after DOD is HHS, health and human services; it receives a 25% cut.
"President Trump on Friday [April 25, 2025] unveiled an initial version of his $1.7 trillion fiscal 2026 discretionary funding budget, which included staggering cuts of 22% to non-defense agencies. (These are budgetary "discretionary" departments, not the "nondiscretionary programs such as Social Security, Medicaid, Medicare.)
The Defense Department would see its funding increased by 13% to more than $1 trillion, more than 10% of which would come in the proposed reconciliation bill. Nearly every other agency in government would see dramatic reductions.
From this article at the CEPR I found a paragraph about spending reductions or eliminated practices:
Example One: Human Rights, "The State Department under Marco Rubio seems to think little of human rights and seeks to change the term’s definition. NPR reports that the department will no longer include criticisms of poor [foreign] prison conditions, [foreign] government corruption, or political processes that are restrictive, in its reports on international human rights. That means [foreign] government repression, such as restricting peaceful assembly or preventing free and fair elections, will no longer be documented by the agency." (from this CEPR.org report)
Example Two: Data on Greenhouse Gases: "The Environmental Protection Agency is planning to eliminate long-standing requirements for polluters to collect and report their emissions of the heat-trapping gases that cause climate change. The move, ordered by a Trump appointee, would affect thousands of industrial facilities across the country, including oil refineries, power plants and coal mines as well as those that make petrochemicals, cement, glass, iron and steel, according to documents reviewed by ProPublica."
Example Three: U.S. Census reduces staff, "As federal agencies brace for the Trump administration's next round of slashing the U.S. government, recent staff departures are already raising concerns about whether the Census Bureau can continue producing reliable statistics for the country."
Example Four: Censuring Academic Journals: "The Trump administration has slashed funding for universities and scientific research. Now, its lackeys appear to be escalating their tactics by menacing academic journals. . . . "A publication's editorial decisions are none of the government's business, whether it's a newspaper or a medical journal," JT Morris, a senior supervising attorney at the Foundation for Individual Rights and Expression"
Example Five: Disappearing Government Agencies' web pages: "On Friday January 31, 2025, several federal government datasets went offline. The datasets taken down included some widely used, large-scale national health surveys, indices, and data dashboards that inform research, policy making, and media coverage about health care and public health. For example, several Centers for Disease Control and Prevention (CDC) surveys and datasets were offline. . . (re a CDC survey now offline) The survey has been used for decades to inform policymakers, the media, and the public on a wide range of health topics, such as obesity rates, access to breast cancer screenings, vaccination rates, and the share of people with pre-existing conditions." (from Kaiser Family Foundation article)
Example Six: Budget Cuts to agencies: Headstart, Environmental Protection Agency, IRS. "Looking at his initial or “skinny” budget proposal, along with an “appendix” the White House released last Friday, Trump’s budget would eliminate at least 46 programs and agencies." (from a PBS article, https://www.pbs.org/newshour/politics/46-programs-trump-wants-to-eliminate-according-to-his-proposed-budget)
Example Seven: Elimination of Climate Change mitigation laws: "Summary
Trump proposes $15 billion cuts to renewable energy, carbon capture
Cancels $6 billion for EV chargers
Unclear how Congress would make cuts to funds already in US law
$4.5 billion in USDA cuts includes conservation programs
Plan entirely cuts EPA program on environmental justice
WASHINGTON, May 2 (Reuters) - U.S. President Donald Trump's administration on Friday proposed cutting billions of dollars in federal funding next year for projects including renewable energy and electric vehicle chargers, and gutting programs aimed at curbing climate change.
The proposal to Congress was part of a wider request to cut $163 billion in 2026 federal spending, slashing more than a fifth of non-military spending.


 I found the graph confusing, but follow the red line, it shows the percentage of budget cuts to various agencies, the right side scale; at the far right the NSF and EPA and SBA receive massive cuts. The averag cut for all is 22%. HUD, State Dept., Dept. of Labor, Dept of Interior that administers Food Stamps (SNAP) are cut by 35%. Social Security appears to receive no cut. The second largest federal department is HHS, health and human services; it receives a 25% cut. Think Medicaid and Medicare.