Did the Trump/Republican Tax Cut of 2017 Help?
During his State of the Union address of 2018 Trump predicted an additional $4,000 of income to all workers would result due to the tax cut. After 22 months the Bureau of Labor Statistics shows that wages for nonsupervisory workers, 80% of all workers, have increased by $1,145 after 22 months, since January 2018, an increase of 2.7%, from $42,302 to $43,447. But this is smaller than the increase between January 2014 and January 2016, when these incomes increased by 4.9% or $1,970 over two years. There was no massive tax cut in 2014. (As a side note, this BLS site will also show that wages for 80% of workers was higher in 1965 than in 2019.) And this link shows "median" not average weekly nominal earnings for the same group, more or less same story.
Has it raised the national debt enormously? Yes. Did the tax cut pay for itself? Not at all.
In August, 2019, the CBO predicted the national debt will rise to 95% of GDP by 2029, from 75% in 2016. That is an increase of $4.6 trillion, or an increase of $27,545 for every worker, and that’s not counting interest on the debt. This new debt cancels any gains in income. In the past two years, the national debt has increased at 150% the rate of Obama’s last five years in office. At ITEP.org the article “The TCJA by the Numbers” runs down the precise cuts to each income group. The top one percent received a $49,980 cut, the middle 20% a $780 cut.
The tax act has spurred enormous stock buybacks. In 2018 large corporations spent over $1 trillion of profits on buybacks. If instead they had increased employee pay, then 61 million workers, employed in companies employing more than 500 workers, would have received a raise of $16,300. The number of full-time workers is double the 61 million, around 120 million. If the 30 companies comprising the Dow Jones Index had not purchased stock but increased wages, then each of their eight million employees would have received $46,000 in added pay.
I invite readers to read the rest of this letter at my blog: http://benL88.blogspot.com, or Economics Without Greed, Part Two. The main idea is that we are truly a very fortunate and prosperous nation, but we fail to lift up the lower half of workers and households; there is far too much poverty and hardship. The United Way charity reports in the ALICE report that 40% of U.S. citizens experience hardship; they go without basic needs. Tax cuts will not create a vibrant middle class, only difficult restructuring of our economy will do it.
Half of Americans report hardship, the finding of an October, 2019, poll:

Reaffirming the findings of the ALICE report from the United Way charity is this recent poll from the Center for American Progress. Importantly it reports, "In addition, the study finds strong support across party lines for economic narratives focused on “taking back our government from wealthy special interests”; making sure government “works for all people”; and finding political leadership committed to “uniting people” around “simple goals we all share.”"
What to read next?
What to read next?
First read the blue quotation just below, and then Jump Down, reader, to the next essay -- A Litany of Economic Woes -- before trying to wade through the next paragraphs here. The Woes essay was published at inequality.org, a newsletter with thousands of readers in November. I think they chose it because it rapidly covers important core strands. The remainder of the discussion here gets into the fine details, the weeds. Stay out of the weeds for now, come back if you are, like me, detail crazy.
Here's a bit more on the tax system.
From the U.C. professor Emmanuel Saez's report on income distribution, the following table. Note the pre-tax, the disposable after-tax, and the after-tax columns: See page 575 here. And then this graph.
The role of food stamps and Medicaid for the poor boost their incomes (not cash income, but in-kind incomes) to $25,500. Later I report that restoring the previous income ratios of 1946 to 1980 would boost pre-tax incomes by $20,000 for all earning less than $110,000 a year. The lower-earning 50% would have incomes of $36,000, not $16,200. Dividing 16% of national income by 125 million workers (77% of all wage earners) according to the Social Security Administration report on wages, yields an increase of $22,800 per worker. 125 million is also half of 250 million, the total number of U.S. adults, roughly. Add 22,800 and 16,200 = 39,000 -- the possible average for half.
By far the most important knowledge about the present economy can be found in a radio interview with U.C. Berkeley professor Emmanuel Saez, a colleague of Thomas Piketty author of Capital in the 21st Century. This interview is on the Doug Henwood program Behind the News (see here, Nov. 7, 2019). Saez (with U.C. professor Zucman) recently discovered that the effective tax rate for the wealthiest 400 Americans is 23%, a tad lower than the rate for the lower-earning 50%, whose incomes average to $18,500 a year per adult. The 400 had incomes averaging around $335 million and paid a lower tax rate. I've read an article by M. Yglesias, and another at the NYTimes. That's plenty. The average income for the top 400? This article at CBS News says the average was $335.7 million per, and the total therefore is $134 billion for 400 households! This paragraph from the NYTimes article sums it up:
The American economy just doesn’t function very well when tax rates on the rich are low and inequality is sky high. It was true in the lead-up to the Great Depression, and it’s been true recently. Which means that raising high-end taxes isn’t about punishing the rich (who, by the way, will still be rich). It’s about creating an economy that works better for the vast majority of Americans.
The radio broadcast is well done, a reminder.
I think most readers will learn more from my next essay, The Litany of Woes, than from my further comments on the TCJA. So my two comments will be short.
One, a professional article from the Economic Policy Institute demonstrates the failure of the TCJA to increase investment; it shows the declines in "nonresidential fixed investment" and in "nondefense capital goods orders". These were touted as the drivers of greater incomes for workers. The BEA.gov shows higher GDP growth since December 2017, but it has since fallen back to a more normal rate and the CBO report predicts a 1.8% growth to year 2029. The boost appears to be temporary, ephemeral, related to higher consumption. The cost of this short boost is massive government debt.
The second issue relates to excessively high tax rates on middle income families. About 20% of middle earning American families, one in five, are being taxed into a level below 4 times the poverty threshold. They need a tax break, a real cut. As reported above the TCJA gave middle income households a $780 tax cut, but in the table below I show they pay about $18,000 a year in total taxes. They need a real cut. The Supplemental Poverty Measure publishes a graph of the "official" poverty report income groups and compares it to the SPM post-transfer post-tax income groups. Here is the important summary shot:
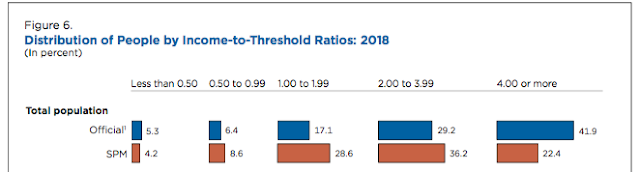
The group at the right, over 4.00 times poverty threshold, the blue box, the pre-tax income represents 41.9% of the population, and in red it's at 22.4%, just above half the population of the first blue group, or one in five families. That means this section of households are taxed below 4 times poverty. I asked myself what incomes would those be?
Four times poverty for 2018 is as follows post-tax income
blue box red box
for one person above $48,560 $35,206
two persons above $65,840 $47,734
for three persons above $83,120 $60,262
for four persons above $100,400. $72,790
A four person family with $100,400 pre-tax income is exactly 4 times poverty threshold, and after-tax it is below the 4 times level. That family's taxes are too high.
I took the "overall and effective" tax rate of 27.5% from the ITEP report "Who Pays Taxes in America in 2019?" "Overall" means taxes paid to federal, state and local. "Effective" means as a percentage of total income. Let's look at the lowest earning 20% of U.S. taxpayers; their average pre-tax income in 2018 was $13,700; they paid 7.5% to the federal government and 12.7% to state and local for an overall effective rate of 20.2%. That reduces their income by $2,767 giving them a post-tax income of $10,933.
To be really precise I look to the U.S. Census report HINC01 to find the median pre-tax incomes for each of these family sizes.
pre-tax O.E. taxes post-tax income
median income median income
for one person $31,954 $6,454 $25,500
for two $70,870 $19,489 $51,381
for three $82,139 $22,588 $59,551
for four $97,522 $26,818 $70,704
In only the two person household is the median post-tax greater than the 4 times poverty amount.
It looks to me that the before-tax middle or median income is about the same as the before-tax "four times poverty" income group, except for the one person household. Meaning? Those middle income families are being taxed too much, their post-tax incomes are all below the 4 times level. They were above the four-times level, except the one person household, and they drop below. They are mostly taxed below the 4 times level.
I look at my old blog, the last essay, the third graph showing income distribution, and it shows that 47% of all pre-tax income goes to the highest earning ten percent. The 90 to 99 percentiles have an average income of $193,000 and the top one percent has income average of $1,300,000 per adult I believe, not per household. The tax rate on high income households, 33.7%, is not much higher than on the middle group, 27.5%, the ITEP.org report shows.
It should also be remembered that the poverty thresholds are very low according many researchers, who maintain that the true poverty level is about 150% of their actual levels, and approximately 27% would be in poverty if that were the official threshold. I read a 2013 article, "Undercounting the Poor", in Dollars and Sense magazine by a professor at UMass/Amherst, Jeannette Wicks-Lim, who wrote, "But this [too low poverty threshold] conflicts with what we know about the economic deprivation that households experience. In the 1999 book Hardship in America, researchers found that near-poor households (households between the poverty line and twice the poverty line) experienced one of more "critical" hardships -- such as missing meals, not getting necessary medical care, or having their utilities disconnected -- at only slightly lower rates than the officially poor (25% compared to 29%). Only when household get above twice the poverty line does the incidence of these economic problems fall substantially -- all the way down to 11%. Twice the poverty line (or about 150% of the SPM) appears to be an excellent marker for when households can meet their basic needs." The 2019 SPM report, covering year 2018, shows that 27.8% of Americans live below 150% of the poverty threshold (Table A-4, page 26). This conforms with the assessment I presented elsewhere from Kathleen Short, long-time researcher for the U.S. Census, who stated that 140% of the poverty threshold was true poverty, and those living at that level or below are "unable to achieve a safe and decent standard of living."
The Joint Committee on Taxation, 2018, shows that 65.5% of households make less than $75,000 and they are taxed from above 4 times to below 4 times the poverty level. The SPM chart above states that only 22.4% of households have post-tax and post-transfer incomes above 4 times poverty. The $75,000 income family's tax rate, overall and effective, is around 27.5%; the top one percent pay 33.7% with incomes 25 to 36 times greater than the 4th quintile groups -- the average income $1,914,000 a year compared to $86,500. The one percent rate is higher by maybe a quarter (a quarter of 28% is 7%, add that to 28 and get 35%).
These middle income households are taxed into the lower income group of 2.00 times to 3.99 times poverty. How many? About one in five, 19.5% of the nation, or 24,960,000 households and that would also be about 65 million citizens, fall into this group. It's an income of about $75,000, very roughly. See that table at "Who Pays Taxes in America in 2019?" published by ITEP.org.
Further on, next essay, I show that the lower-earning 50% receives $1 of income while the top one percent receives $81. The average yearly income for the lower half is $16,200 and for the top 1% $1.3 million, a 1 to 81 ratio. Such a startling ratio, but their "overall effective" tax rate is not that much greater, 22% compared to 33.7%.
A WEALTH TAX IS A GOOD IDEA
I hate to go on, but I must. Wealth -- we need a wealth tax. Since January 2009 wealth has doubled, even though the economy in the past ten years sputtered and disappointed millions. The "household net worth" has increased from $48 trillion to $113 trillion, a $65 trillion gain (see the Federal Reserve report Flow of Funds page 2 and Table 101, and see the 2010 report to find the $48 trillion figure), and adjusting for inflation that is a 95% increase. The $65 trillion gain is -- so big it cannot be imagined. Briefly, each individual in the top one percent has an annual cash income of $1.3 million (see the graph at my past blog that I mentioned above) and an added $0.9 million in non-realized capital gains for a total per adult income of $2.2 million (I won't show you the math, but I believe I did it right.) I imagine most of these one percenters live in a married condition and their household income is double the $2.2 million for one person income, or it is $4.4 million a year -- annual household income. And without a major collapse of the stock market, which is somewhat likely but not guaranteed, they will continue to be taxed at 33.7% yearly, just above 27.5% that an income of $86,500 is taxed. An income of $4.4 million is 51 times that of $86,500. !!! Fair? Even if I overstated the income, it's important to realize the effect of a dual income, that of cash and that of investment (unrealized) income. Warren and Sanders have it right.
Here's a quote from Thomas Piketty, the famous economist from France, on the need for higher tax rates on the richest: Between 1930 and 1980, the rate applied on the highest incomes was on average 81% in the United States, and the rate applied to the highest inherited estates was 74%. Clearly this did not destroy American capitalism, far from it. It made it more egalitarian and more productive, at a time when the United States had not forgotten that it was their level of educational advancement and their investment in training and skills that was the backbone of their prosperity, and not the religion of property and inequality.
The true wealth are the people, their skills, tools, and ethical standard of culture -- sense of fairness, willingness to care, help, deal justly with one another. It's not a dollar amount. The entire world is now caught up in this underlying problem and dilemma. We need to share our prosperity and save the planet from carbon asphyxiation at the same time.
From the U.C. professor Emmanuel Saez's report on income distribution, the following table. Note the pre-tax, the disposable after-tax, and the after-tax columns: See page 575 here. And then this graph.
Income growth in the US, 1980-2014
The role of food stamps and Medicaid for the poor boost their incomes (not cash income, but in-kind incomes) to $25,500. Later I report that restoring the previous income ratios of 1946 to 1980 would boost pre-tax incomes by $20,000 for all earning less than $110,000 a year. The lower-earning 50% would have incomes of $36,000, not $16,200. Dividing 16% of national income by 125 million workers (77% of all wage earners) according to the Social Security Administration report on wages, yields an increase of $22,800 per worker. 125 million is also half of 250 million, the total number of U.S. adults, roughly. Add 22,800 and 16,200 = 39,000 -- the possible average for half.
By far the most important knowledge about the present economy can be found in a radio interview with U.C. Berkeley professor Emmanuel Saez, a colleague of Thomas Piketty author of Capital in the 21st Century. This interview is on the Doug Henwood program Behind the News (see here, Nov. 7, 2019). Saez (with U.C. professor Zucman) recently discovered that the effective tax rate for the wealthiest 400 Americans is 23%, a tad lower than the rate for the lower-earning 50%, whose incomes average to $18,500 a year per adult. The 400 had incomes averaging around $335 million and paid a lower tax rate. I've read an article by M. Yglesias, and another at the NYTimes. That's plenty. The average income for the top 400? This article at CBS News says the average was $335.7 million per, and the total therefore is $134 billion for 400 households! This paragraph from the NYTimes article sums it up:
The American economy just doesn’t function very well when tax rates on the rich are low and inequality is sky high. It was true in the lead-up to the Great Depression, and it’s been true recently. Which means that raising high-end taxes isn’t about punishing the rich (who, by the way, will still be rich). It’s about creating an economy that works better for the vast majority of Americans.
The radio broadcast is well done, a reminder.
I think most readers will learn more from my next essay, The Litany of Woes, than from my further comments on the TCJA. So my two comments will be short.
One, a professional article from the Economic Policy Institute demonstrates the failure of the TCJA to increase investment; it shows the declines in "nonresidential fixed investment" and in "nondefense capital goods orders". These were touted as the drivers of greater incomes for workers. The BEA.gov shows higher GDP growth since December 2017, but it has since fallen back to a more normal rate and the CBO report predicts a 1.8% growth to year 2029. The boost appears to be temporary, ephemeral, related to higher consumption. The cost of this short boost is massive government debt.
The second issue relates to excessively high tax rates on middle income families. About 20% of middle earning American families, one in five, are being taxed into a level below 4 times the poverty threshold. They need a tax break, a real cut. As reported above the TCJA gave middle income households a $780 tax cut, but in the table below I show they pay about $18,000 a year in total taxes. They need a real cut. The Supplemental Poverty Measure publishes a graph of the "official" poverty report income groups and compares it to the SPM post-transfer post-tax income groups. Here is the important summary shot:

The group at the right, over 4.00 times poverty threshold, the blue box, the pre-tax income represents 41.9% of the population, and in red it's at 22.4%, just above half the population of the first blue group, or one in five families. That means this section of households are taxed below 4 times poverty. I asked myself what incomes would those be?
Four times poverty for 2018 is as follows post-tax income
blue box red box
for one person above $48,560 $35,206
two persons above $65,840 $47,734
for three persons above $83,120 $60,262
for four persons above $100,400. $72,790
A four person family with $100,400 pre-tax income is exactly 4 times poverty threshold, and after-tax it is below the 4 times level. That family's taxes are too high.
I took the "overall and effective" tax rate of 27.5% from the ITEP report "Who Pays Taxes in America in 2019?" "Overall" means taxes paid to federal, state and local. "Effective" means as a percentage of total income. Let's look at the lowest earning 20% of U.S. taxpayers; their average pre-tax income in 2018 was $13,700; they paid 7.5% to the federal government and 12.7% to state and local for an overall effective rate of 20.2%. That reduces their income by $2,767 giving them a post-tax income of $10,933.
To be really precise I look to the U.S. Census report HINC01 to find the median pre-tax incomes for each of these family sizes.
pre-tax O.E. taxes post-tax income
median income median income
for one person $31,954 $6,454 $25,500
for two $70,870 $19,489 $51,381
for three $82,139 $22,588 $59,551
for four $97,522 $26,818 $70,704
In only the two person household is the median post-tax greater than the 4 times poverty amount.
It looks to me that the before-tax middle or median income is about the same as the before-tax "four times poverty" income group, except for the one person household. Meaning? Those middle income families are being taxed too much, their post-tax incomes are all below the 4 times level. They were above the four-times level, except the one person household, and they drop below. They are mostly taxed below the 4 times level.
I look at my old blog, the last essay, the third graph showing income distribution, and it shows that 47% of all pre-tax income goes to the highest earning ten percent. The 90 to 99 percentiles have an average income of $193,000 and the top one percent has income average of $1,300,000 per adult I believe, not per household. The tax rate on high income households, 33.7%, is not much higher than on the middle group, 27.5%, the ITEP.org report shows.
It should also be remembered that the poverty thresholds are very low according many researchers, who maintain that the true poverty level is about 150% of their actual levels, and approximately 27% would be in poverty if that were the official threshold. I read a 2013 article, "Undercounting the Poor", in Dollars and Sense magazine by a professor at UMass/Amherst, Jeannette Wicks-Lim, who wrote, "But this [too low poverty threshold] conflicts with what we know about the economic deprivation that households experience. In the 1999 book Hardship in America, researchers found that near-poor households (households between the poverty line and twice the poverty line) experienced one of more "critical" hardships -- such as missing meals, not getting necessary medical care, or having their utilities disconnected -- at only slightly lower rates than the officially poor (25% compared to 29%). Only when household get above twice the poverty line does the incidence of these economic problems fall substantially -- all the way down to 11%. Twice the poverty line (or about 150% of the SPM) appears to be an excellent marker for when households can meet their basic needs." The 2019 SPM report, covering year 2018, shows that 27.8% of Americans live below 150% of the poverty threshold (Table A-4, page 26). This conforms with the assessment I presented elsewhere from Kathleen Short, long-time researcher for the U.S. Census, who stated that 140% of the poverty threshold was true poverty, and those living at that level or below are "unable to achieve a safe and decent standard of living."
The Joint Committee on Taxation, 2018, shows that 65.5% of households make less than $75,000 and they are taxed from above 4 times to below 4 times the poverty level. The SPM chart above states that only 22.4% of households have post-tax and post-transfer incomes above 4 times poverty. The $75,000 income family's tax rate, overall and effective, is around 27.5%; the top one percent pay 33.7% with incomes 25 to 36 times greater than the 4th quintile groups -- the average income $1,914,000 a year compared to $86,500. The one percent rate is higher by maybe a quarter (a quarter of 28% is 7%, add that to 28 and get 35%).
These middle income households are taxed into the lower income group of 2.00 times to 3.99 times poverty. How many? About one in five, 19.5% of the nation, or 24,960,000 households and that would also be about 65 million citizens, fall into this group. It's an income of about $75,000, very roughly. See that table at "Who Pays Taxes in America in 2019?" published by ITEP.org.
Further on, next essay, I show that the lower-earning 50% receives $1 of income while the top one percent receives $81. The average yearly income for the lower half is $16,200 and for the top 1% $1.3 million, a 1 to 81 ratio. Such a startling ratio, but their "overall effective" tax rate is not that much greater, 22% compared to 33.7%.
A WEALTH TAX IS A GOOD IDEA
I hate to go on, but I must. Wealth -- we need a wealth tax. Since January 2009 wealth has doubled, even though the economy in the past ten years sputtered and disappointed millions. The "household net worth" has increased from $48 trillion to $113 trillion, a $65 trillion gain (see the Federal Reserve report Flow of Funds page 2 and Table 101, and see the 2010 report to find the $48 trillion figure), and adjusting for inflation that is a 95% increase. The $65 trillion gain is -- so big it cannot be imagined. Briefly, each individual in the top one percent has an annual cash income of $1.3 million (see the graph at my past blog that I mentioned above) and an added $0.9 million in non-realized capital gains for a total per adult income of $2.2 million (I won't show you the math, but I believe I did it right.) I imagine most of these one percenters live in a married condition and their household income is double the $2.2 million for one person income, or it is $4.4 million a year -- annual household income. And without a major collapse of the stock market, which is somewhat likely but not guaranteed, they will continue to be taxed at 33.7% yearly, just above 27.5% that an income of $86,500 is taxed. An income of $4.4 million is 51 times that of $86,500. !!! Fair? Even if I overstated the income, it's important to realize the effect of a dual income, that of cash and that of investment (unrealized) income. Warren and Sanders have it right.
Here's a quote from Thomas Piketty, the famous economist from France, on the need for higher tax rates on the richest: Between 1930 and 1980, the rate applied on the highest incomes was on average 81% in the United States, and the rate applied to the highest inherited estates was 74%. Clearly this did not destroy American capitalism, far from it. It made it more egalitarian and more productive, at a time when the United States had not forgotten that it was their level of educational advancement and their investment in training and skills that was the backbone of their prosperity, and not the religion of property and inequality.
The true wealth are the people, their skills, tools, and ethical standard of culture -- sense of fairness, willingness to care, help, deal justly with one another. It's not a dollar amount. The entire world is now caught up in this underlying problem and dilemma. We need to share our prosperity and save the planet from carbon asphyxiation at the same time.
No comments:
Post a Comment